3.33 ns 3.33 s 3.33 ms
Review of Sinusoidal Signals
The circuit in Figure elcric shows a generator and load connected with a cable, just as in the circuits lab. In the analysis and measurements in the circuit labs, the cable is usually ignored.
Let us assume that the switch closes, and the generator produces a step function at time t=0, as shown in Figure timedelaysig. Because the electrical signals propagate with light speed, the signal needs T sec to appear at the load after the switch closes. Figure delayedsig shows the step signal as it travels on the transmission line at different times t=0, t=T/4, t=T/2, and t=T.
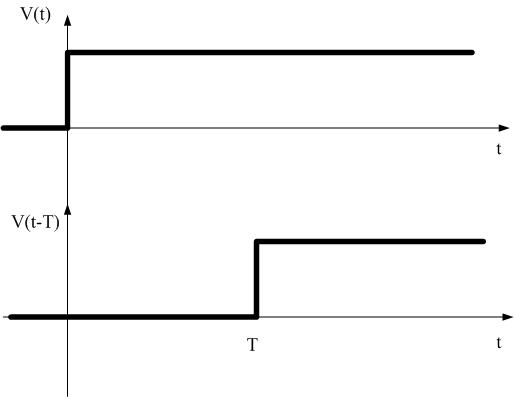
Figure 2: Voltage as a function of time at the generator side (top) and the
load side (bottom) of a transmission line, if the switch closes at t=0 the voltage
arrives at t=l/c=T at the load. These graphs can be obtained by observing the
voltage on an oscilloscope at the load and at the generator side.
How much time T does it take for this signal to go from AA’ end to BB’ end? Since electromagnetic waves propagate with the constant speed, the speed of light, the time that the signal needs to go from the generator to the load depends on the transmission line’s length. If the transmission line is , then the delay between the generator and the load will be , where . If the signal at the generator AA’ is v(t), then the signal at the load end is v(t-T).
Figure delayedsig shows the signal on the transmission line at different times. Note that the horizontal axis shows distance, not time. Each graph shows a snapshot of the signal on the transmission line at different times. The top figure shows the moment when we turn the switch on, at t=0, and the signal shows up at the beginning of the transmission line, at the generator’s end. A little later, at t=1=T/4, the front of the signal traveled a little farther along the line. At t=2=T/2, the signal traveled even further on the line. The bottom figure shows the signal that arrived at the load at some time t=4=T. Note that the load will not see the signal until t=4=T.
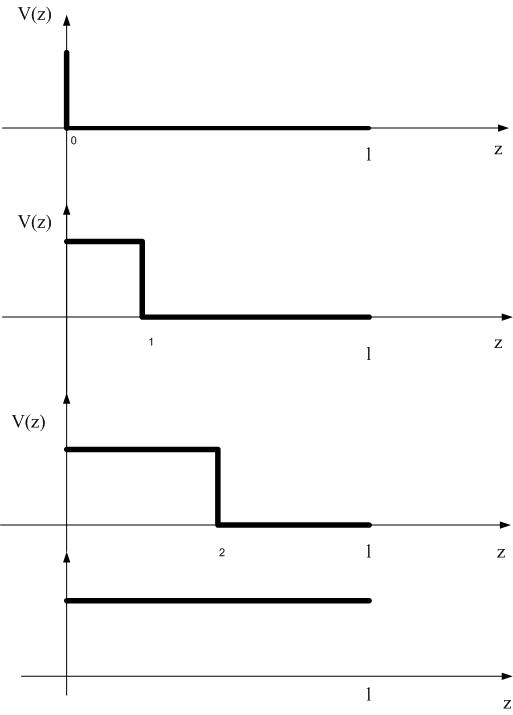
Figure 3: Voltage along the transmission line in Figure elcric, for four different time
intervals t=0, switch closes, t=T/4, t=T/2 and t=T. It is assumed that the
length of the transmission line is equal to l=T/c.Note that the horizontal axis
is the distance z from the generator to the cable, not time.
How much time will the signal need to arrive at the load? We know that the speed of light is m/s. Since this is a constant speed, the time is , where l is the transmission line’s length.