Graphs are wonderful tools! They provide a global view and quickly highlight trends in behavior, maximum and minimum values, and sudden changes.
We rely on graphs quite a bit in our analysis.
Graphs are also inaccurate and untrustworthy.
They can’t help it. By their very construction, they hide important details and mislead us.
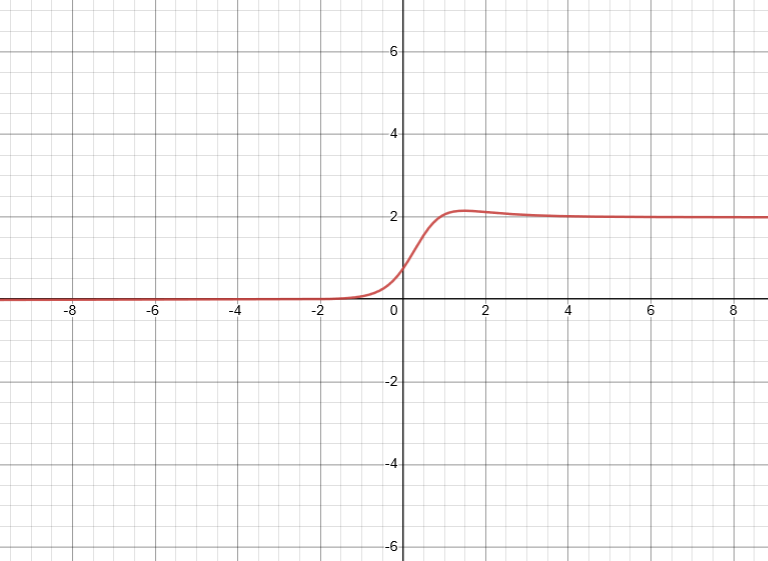
Where do you think the horizontal asymptote is on this graph?
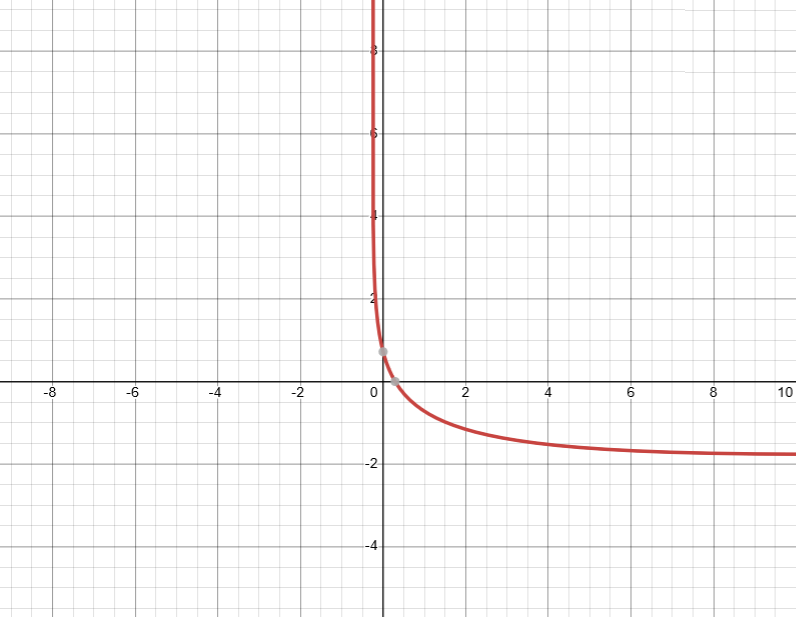
If this is the graph of a function, then it appears that the function levels off to an approximate value of \(-1.75\).
Except, it doesn’t. The graph actually goes up.
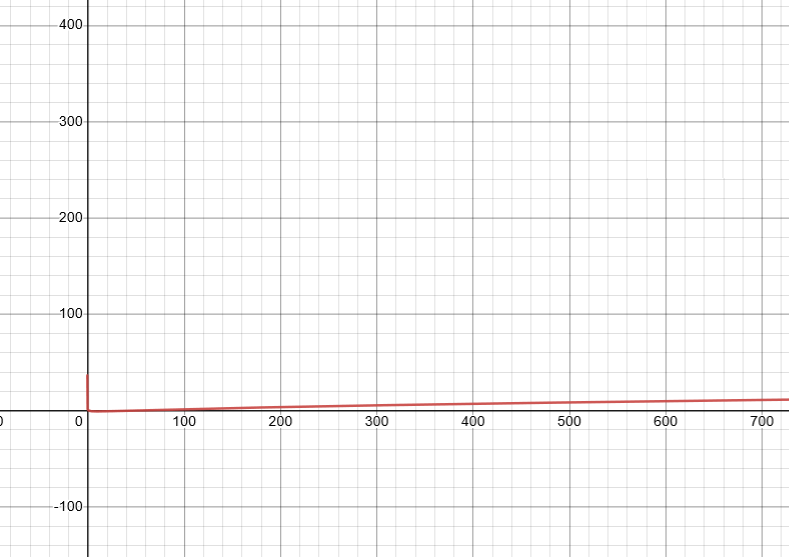
This would have been immediately clear with algebra.
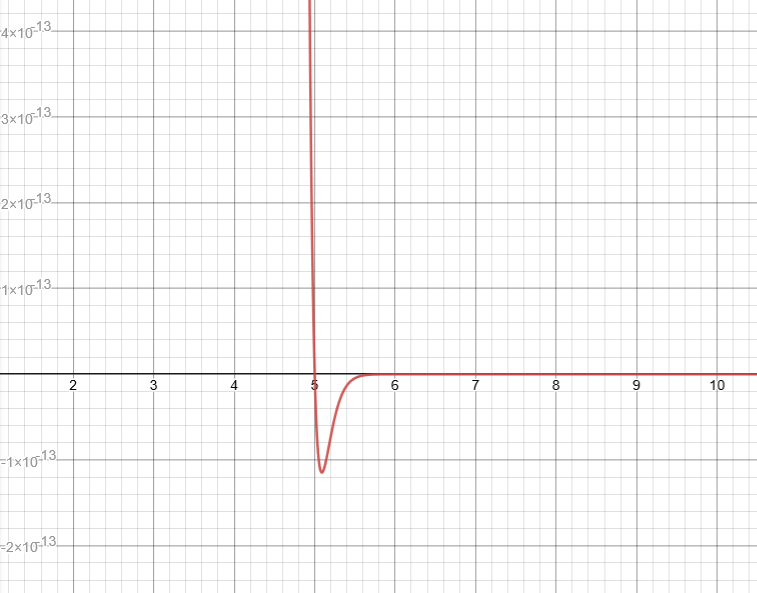
This graph appears to have \(t=2\) as a vertical asymptote.
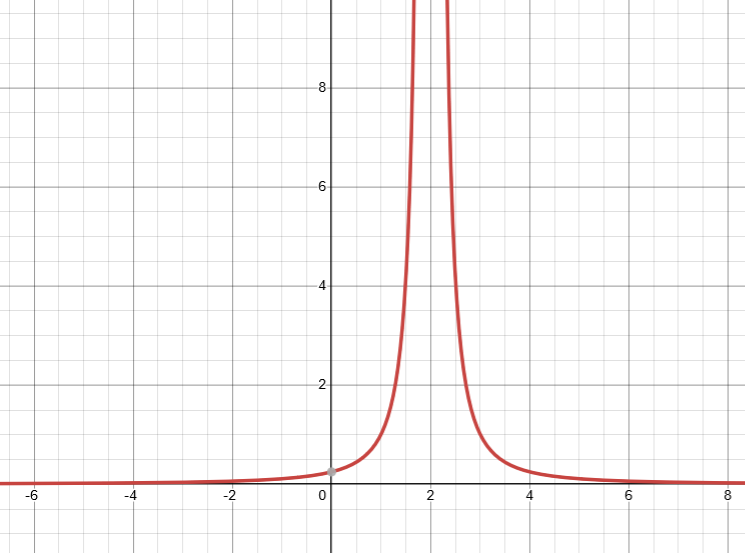
It appears that \(2\) is not in the domain.
Except, that is incorrect.
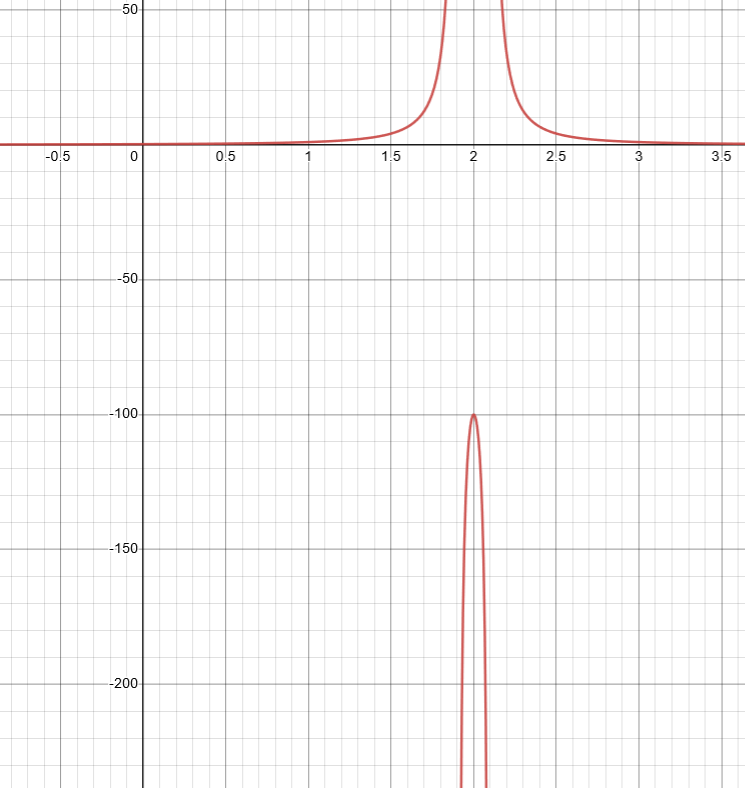
\(2\) is in the domain. \(1.9\) and \(2.1\) are not.
This would have been immediately clear with algebra.
The function graphed below appears to be decreasing on the interval \((-0.2, \infty )\).
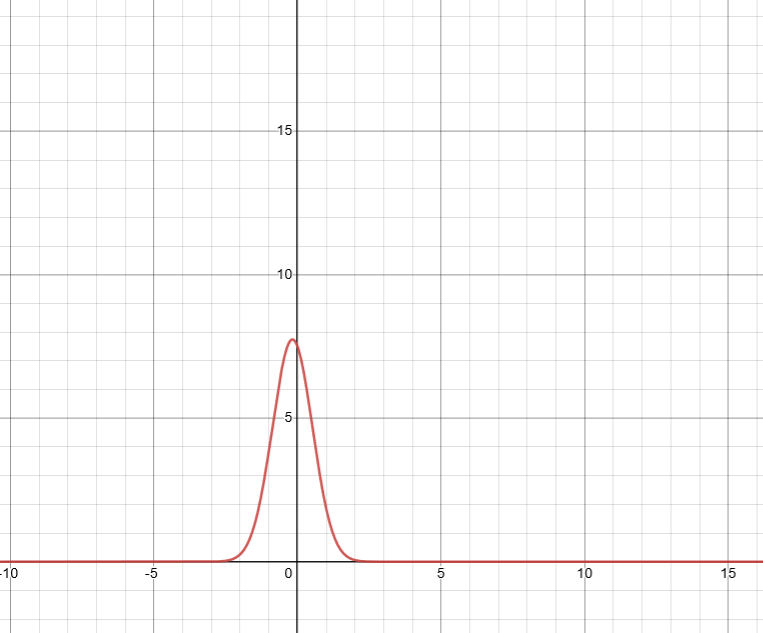
Except, that is incorrect.
This function actually has negative values and is actually increasing where it looked like it was decreasing.
Again, algebra would have hinted at this behavior.
The function graphed below has different limiting values depending on which way you are looking.
Except, that this function is unbounded.
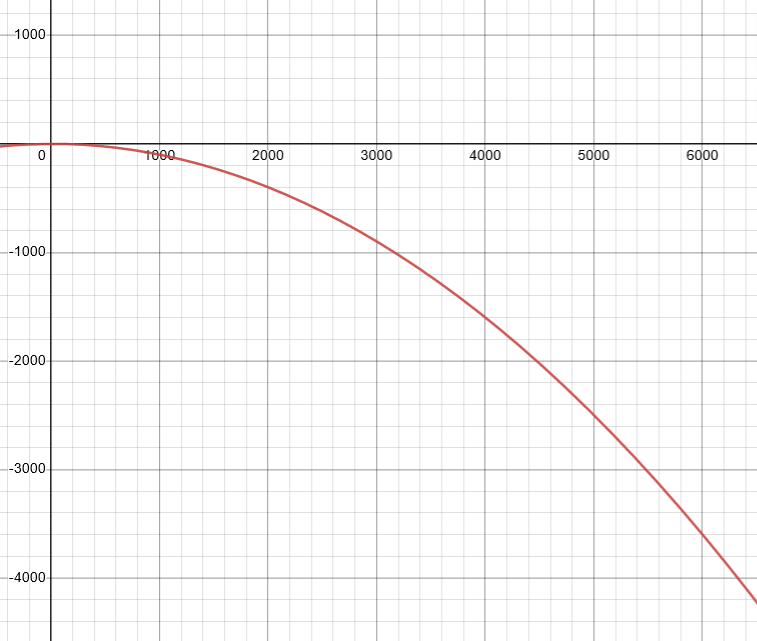
Again, algebra would have hinted at this behavior.
Graphs are inherently inaccurate. There is no way around that fact. We love graphs and we use them all of the time.
We are also distrustful of graphs. We are suspicous of graphs.
Graphs suggest, but we want algebraic verification.
Hence, algebra is our goal.
ooooo-=-=-=-ooOoo-=-=-=-ooooo
more examples can be found by following this link
More Examples of Graphical Language