- a.
- Let and . Determine a formula for that depends only on and not on or . What is the biggest difference between your work in this problem compared to the example above?
- b.
- Let and recall that . Determine a formula for that depends only on .
- c.
- Suppose that . Determine formulas for two related functions, and , so that .
We explore how when can combine two functions by composing them. That is, how we can plug one function into another to create a new function.
Motivating Questions
- How does the process of function composition produce a new function from two other functions?
- In the composite function , what do we mean by the “inner” and “outer” function?
- How does the expression for involve a composite function?
Introduction
Recall that a function, by definition, is a process that takes a collection of inputs and produces a corresponding collection of outputs in such a way that the process produces one and only one output value for any single input value. Because every function is a process, it makes sense to think that it may be possible to take two function processes and do one of the processes first, and then apply the second process to the result.
Suppose we know that is a function of according to the process defined by and, in
turn, is a function of via . Is it possible to combine these processes to generate a
new function so that is a function of ?
Since depends on and depends on , it follows that we can also think of
depending directly on . Let’s looks at this as an arrow diagram with a few sample
points.
Notice that if we take a point such as , we can put that value in for in the function . This will give Now we have an -value of . takes in -values so we can put into . This will give
You should verify that the arrow diagram above gives the correct values of that corresponds to and .
Now, we would like to create a new function that will directly take in any value and give us the corresponding value. We can use substitution and the notation of functions to determine this function.
First, it’s important to realize what the rule for tells us. In words, says “to generate the output that corresponds to an input, take the input and square it, and then subtract .” In symbols, we might express more generally by writing “.”
Now, observing that and that , we can substitute the expression for in . Doing so,
Applying the process defined by the function to the input , we see that
which defines as a function of .One way to think about the substitution above is that we are putting the entire expression inside the input box in “.” That is, . For the substitution, we are thinking of as a single object!
When we have a situation such as in the example above where we use the output of one function as the input of another, we often say that we have composed two functions. In addition, we use the notation to denote that a new function, , results from composing the two functions and .
Composing Two Functions
Whenever we have two functions, and , where the outputs of match inputs of , it is possible to link the two processes together to create a new process that we call the composition of and .
If and are functions, we define the composition of and to be the new function
given by
This composition is denoted by , where means the single function defined by
.
We sometimes call the “inner function” and the “outer function”. It is important to note that the inner function is actually the first function that gets applied to a given input, and then the outer function is applied to the output of the inner function. In addition, in order for a composite function to make sense, we need to ensure that the outputs of the inner function are values that it makes sense to put into the outer function so that the resulting composite function is defined.
In addition to the possibility that functions are given by formulas, functions can be given by tables or graphs. We can think about composite functions in these settings as well, and the following activities prompt us to consider functions given in this way.
Let functions and be given by the graphs below (which are each piecewise linear -
that is, parts that look like straight lines are straight lines) and let and be given by
the table below.
Compute each of the following quantities or explain why they are not defined.
- a.
- b.
- c.
- d.
- e.
- f.
- g.
- For what value(s) of is ?
- h.
- For what value(s) of is ?
Composing functions in content
In the late 1800s, the physicist Amos Dolbear was listening to crickets chirp and noticed a pattern: how frequently the crickets chirped seemed to be connected to the outside temperature. If we let represent the temperature in degrees Fahrenheit and the number of chirps per minute, we can summarize Dolbear’s observations with the following function, . Scientists who made many additional cricket chirp observations following Dolbear’s initial counts found that this formauls holds with remarkable accuracy for the snowy tree cricket in temperatures ranging from to . This function is called Dolbear’s Law.
In what follows, we replace with to emphasize that temperature is measured in Fahrenheit degrees.
The Celsius and Fahrenheit temperature scales are connected by a linear function. Indeed, the function that converts Fahrenheit to Celsius is
For instance, a Fahrenheit temperature of degrees corresponds to degrees Celsius. Let be Dolbear’s function that converts an input of number of chirps per minute to
degrees Fahrenheit, and let be the function that converts an input of degrees
Fahrenheit to an output of degrees Celsius.
- a.
- Determine a formula for the new function that depends only on the variable .
- b.
- What is the meaning of the function you found in (a)?
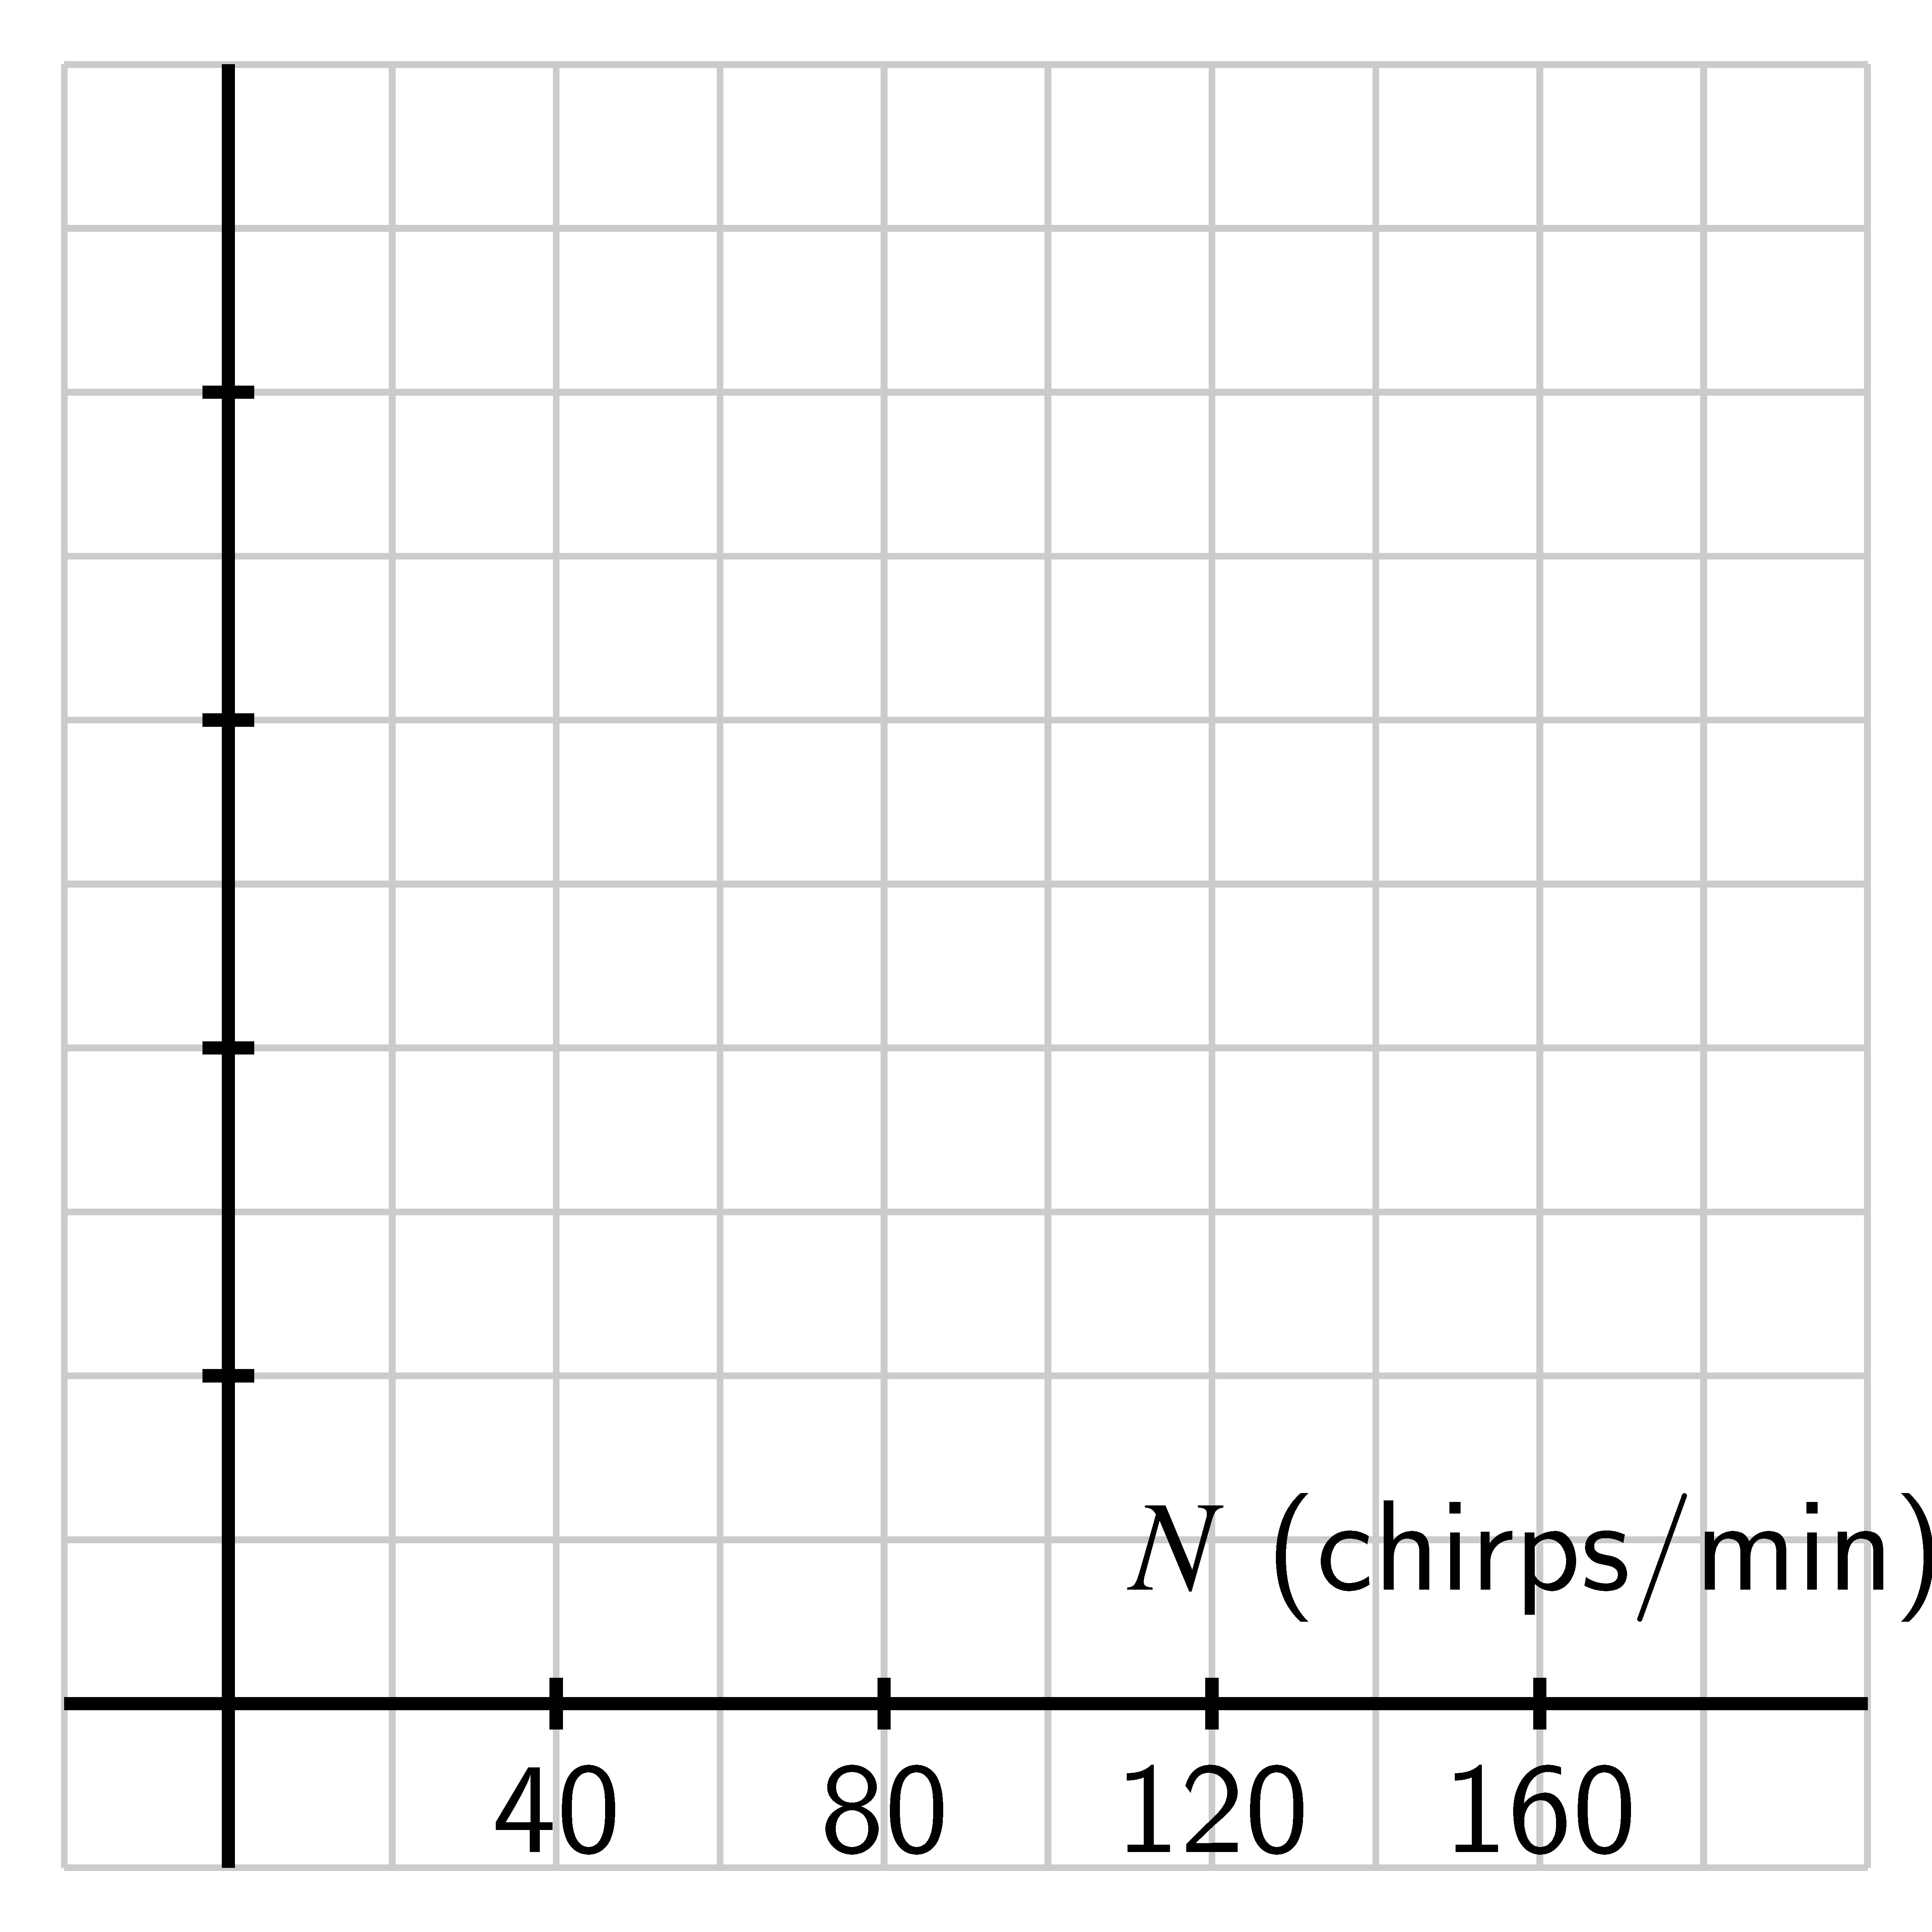
- c.
- Let . How does a plot of the function compare to the that of Dolbear’s
function? Sketch a plot of on the blank axes to the right of the plot of
Dolbear’s function, and discuss the similarities and differences between them.
Be sure to label the vertical scale on your axes.
Function Composition and Average Rate of Change
Recall that the average rate of change of a function on the interval is given by
In the graph below, we see the familiar representation of as the slope of the line joining the points and on the graph of .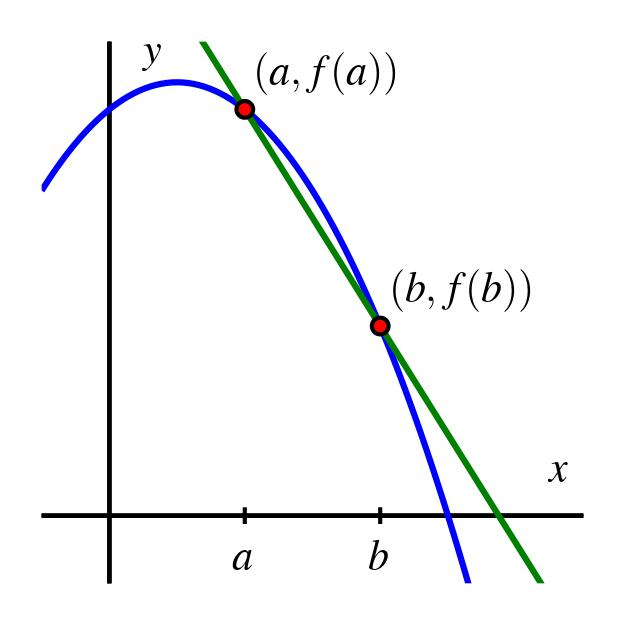
In the study of calculus, we progress from the average rate of change on an interval to the instantaneous rate of change of a function at a single value; the core idea that allows us to move from an average rate to an instantaneous one is letting the interval shrink in size.
To think about the interval shrinking while stays fixed, we often change our perspective and think of as , where measures the horizontal difference from to .
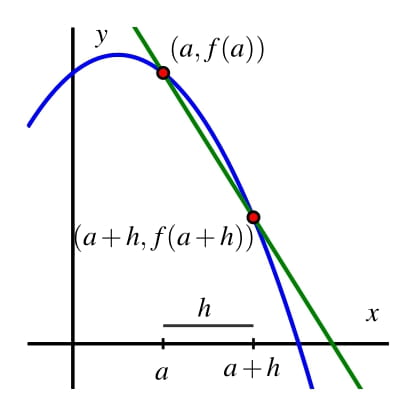
This allows us to eventually think about getting closer and closer to , and in that context we consider the equivalent expression
for the average rate of change of on .Suppose that . Determine the simplest possible expression you can find for , the
average rate of change of on the interval .
Let and .
- a.
- Compute and expand and simplify the result as much as possible by combining like terms.
- b.
- Determine the most simplified expression you can for the average rate of change of on the interval . That is, determine for and simplify the result as much as possible.
- c.
- Compute . Is there any valid algebra you can do to write more simply?
- d.
- Determine the most simplified expression you can for the average rate of change of on the interval . That is, determine for and simplify the result.
- When defined, the composition of two functions and produces a single new function according to the rule . We note that is applied first to the input , and then is applied to the output that results from .
- In the composite function , the “inner” function is and the function is . Note that the inner function gets applied to first, even though the outer function appears first when we read from left to right.
- Because the expression is defined by and this includes the quantity , the average rate of change of a function on the interval always involves the evaluation of a composite function expression. This idea plays a crucial role in the study of calculus.