You are about to erase your work on this activity. Are you sure you want to do this?
Updated Version Available
There is an updated version of this activity. If you update to the most recent version of this activity, then your current progress on this activity will be erased. Regardless, your record of completion will remain. How would you like to proceed?
Mathematical Expression Editor
We explore how mathematics, and graphs in particular, allow us to describe and
investigate the relationships between two variables changing in tandem.
Motivating Questions
If we have two quantities that are changing in tandem, how can we connect
the quantities and understand how change in one affects the other?
When the amount of water in a tank is changing, what behaviors can we
observe?
Introduction
Mathematics is the art of making sense of patterns. One way that patterns
arise is when two quantities are changing in tandem. In this setting, we
may make sense of the situation by expressing the relationship between the
changing quantities through words, through images, through data, or through a
formula.
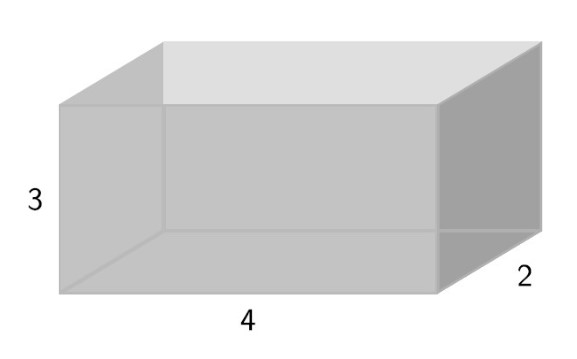
Suppose that a rectangular aquarium is being filled with water. The tank is feet
long by feet wide by feet high, and the hose that is filling the tank is delivering
water at a rate of cubic feet per minute.
a.
What are some different quantities that are changing in this scenario?
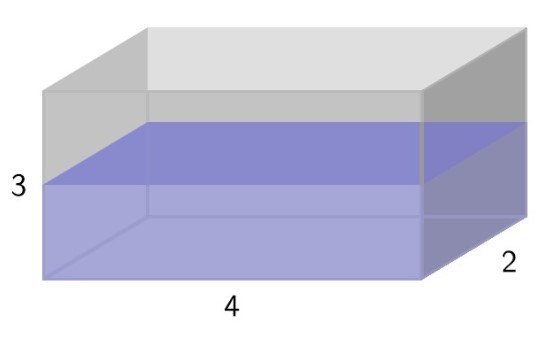
b.
After minute has elapsed, how much water is in the tank? At this moment,
how deep is the water?
c.
How much water is in the tank and how deep is the water after minutes?
After minutes?
d.
How long will it take for the tank to be completely full? Why?
Using Graphs to Represent Relationships
In the previous activity, we saw how several changing quantities were related in the
setting of an aquarium filling with water: time, the depth of the water, and the total
amount of water in the tank are all changing, and any pair of these quantities
changes in related ways. One way that we can make sense of the situation is to record
some data in a table. For instance, observing that the tank is filling at a rate of
cubic feet per minute, this tells us that after minute there will be cubic feet of water
in the tank, and after minutes there will be cubic foot of water in the tank, and so
on. If we let denote the time in minutes and the amount of water in the tank at
time , we can represent the relationship between these quantities through a
table.
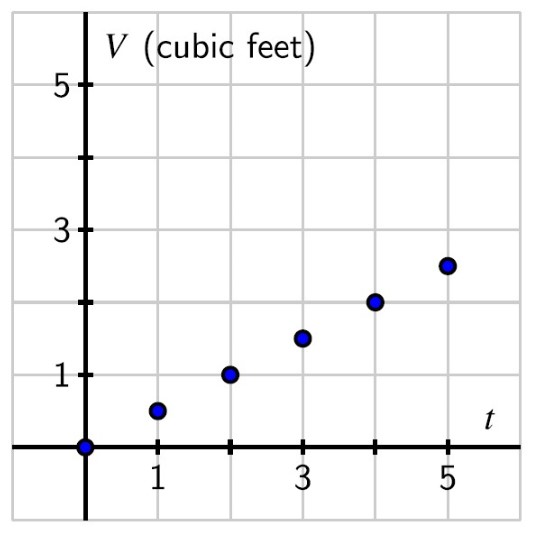
We can also represent this data in a graph by plotting ordered pairs on a system of
coordinate axes, where represents the horizontal distance of the point from the
origin, , and represents the vertical distance from . The visual representation of the
table of values is seen in the graph below.
Sometimes it is possible to use variables and one or more equations to connect
quantities that are changing in tandem. In the aquarium example from the preview
activity, we can observe that the volume, , of a rectangular box that has length ,
width , and height is given by
and thus, since the water in the tank will always have length feet and width feet,
the volume of water in the tank is directly related to the depth of water in the tank
by the equation
Depending on which variable we solve for, we can either see how depends on
through the equation , or how depends on via the equation . From either
perspective, we observe that as depth or volume increases, so must volume or depth
correspondingly increase.
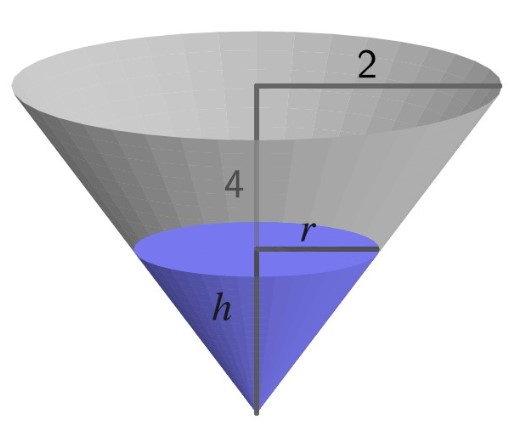
Consider a tank in the shape of an inverted circular cone (point down) where
the tank’s radius is feet and its depth is feet. Suppose that the tank is
being filled with water that is entering at a constant rate of cubic feet per
minute.
a.
Sketch a labeled picture of the tank, including a snapshot of there being
water in the tank prior to the tank being completely full.
b.
What are some quantities that are changing in this scenario? What are
some quantities that are not changing?
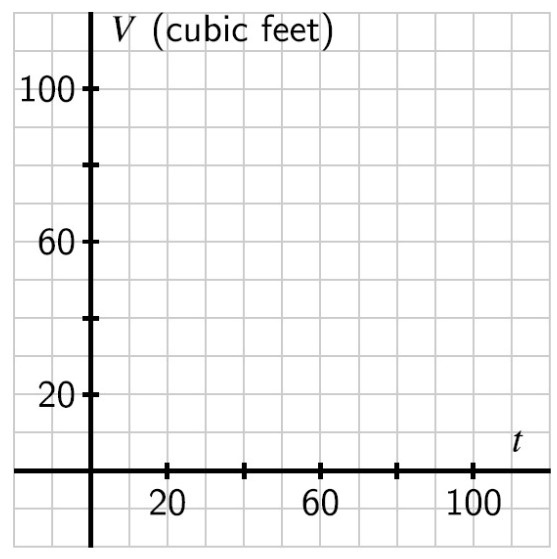
c.
Fill in the following table of values to determine how much water, , is
in the tank at a given time in minutes, , and thus generate a graph of
the relationship between volume and time by plotting the data on the
provided axes.
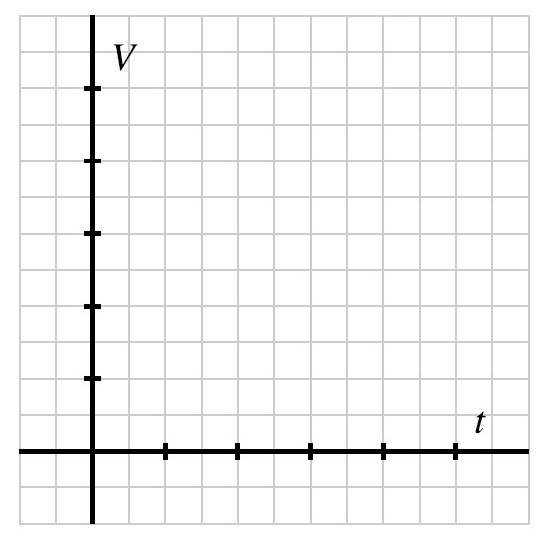
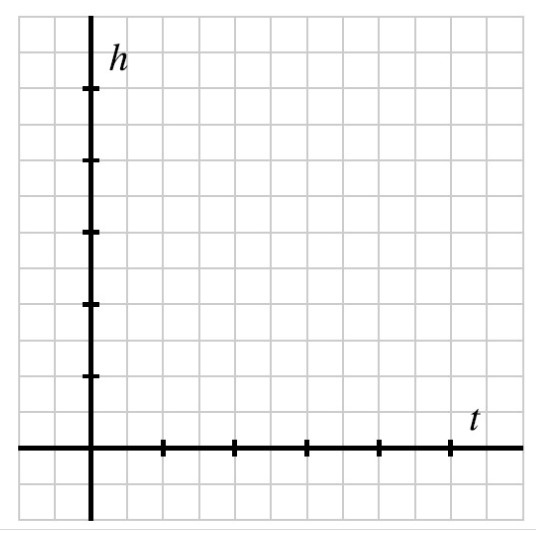
d.
Finally, think about how the height of the water changes in tandem with time.
Without attempting to determine specific values of at particular values of ,
how would you expect the data for the relationship between and
to appear? Use the provided axes to sketch at least two possibilities;
write at least one sentence to explain how you think the graph should
appear.
Using a Table to Add Perspective
One of the ways that we make sense of mathematical ideas is to view them from
multiple perspectives. Sometimes we use different means to establish a point of
view: words, numerical data, graphs, or symbols. In addition, sometimes
by changing our perspective within a particular approach we gain deeper
insight.
Table How time, volume, and height change in a conical tank
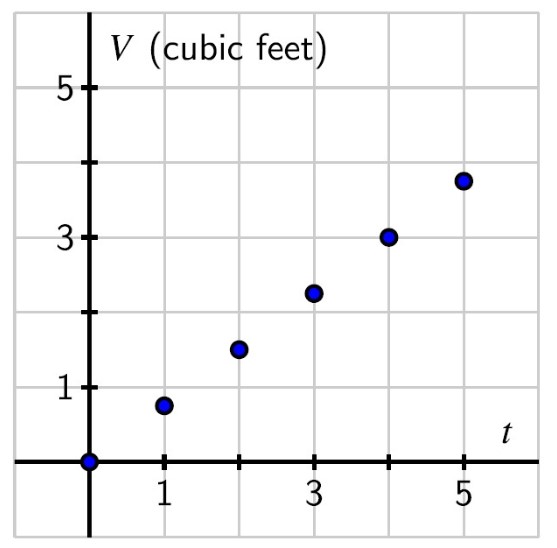
Plotting this data on two different sets of axes allows us to see the different ways that
and change with . First we graph how volume changes over time.
Volume increases at a constant rate, as seen by the straight line appearance of the
points in the graph above.
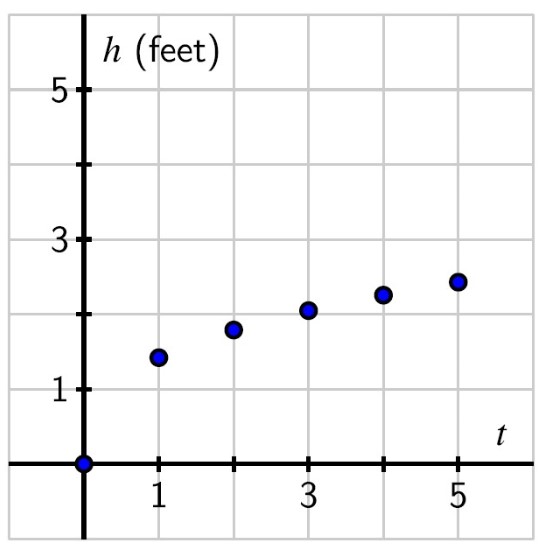
Now let’s graph how height changes over time.
We observe that the water’s height increases in a way that it rises more slowly as
time goes on, as shown by the way the curve the points lie on in the graph below
“bends down” as time passes.
These different behaviors make sense because of the shape of the tank. Since at first
there is less volume relative to depth near the cone’s point, as water flows in at a
constant rate, the water’s height will rise quickly. But as time goes on and more
water is added at the same rate, there is more space for the water to fill in order to
make the water level rise, and thus the water’s heigh rises more and more slowly as
time passes.
Consider a tank in the shape of a sphere where the tank’s radius is feet. Suppose
that the tank is initially completely full and that it is being drained by a pump at a
constant rate of cubic feet per minute.
a.
Sketch a labeled picture of the tank, including a snapshot of some water
remaining in the tank prior to the tank being completely empty.
b.
What are some quantities that are changing in this scenario? What are
some quantities that are not changing?
c.
Recall that the volume of a sphere of radius is . When the tank is
completely full at time right before it starts being drained, how much
water is present?
d.
How long will it take for the tank to drain completely?
e.
Fill in the following table of values to determine how much water, , is in
the tank at a given time in minutes, , and thus generate a graph of the
relationship between volume and time. Write a sentence to explain why
the data’s graph appears the way that it does.
f.
Finally, think about how the height of the water changes in tandem with time.
What is the height of the water when ? What is the height when the tank is
empty? How would you expect the data for the relationship between and
to appear? Use the provided axes to sketch at least two possibilities;
write at least one sentence to explain how you think the graph should
appear.
When two related quantities are changing in tandem, we can better
understand how change in one affects the other by using data, graphs,
words, or algebraic symbols to express the relationship between them. See,
for instance, Table 1.1.10, Figure 1.1.11, and 1.1.12 that together help
explain how the height and volume of water in a conical tank change as
time changes.
When the amount of water in a tank is changing, we can observe other
quantities that change, depending on the shape of the tank. For instance,
if the tank is conical, we can consider both the changing height of the
water and the changing radius of the surface of the water. In addition,
whenever we think about a quantity that is changing as time passes, we
note that time itself is changing.