You are about to erase your work on this activity. Are you sure you want to do this?
Updated Version Available
There is an updated version of this activity. If you update to the most recent version of this activity, then your current progress on this activity will be erased. Regardless, your record of completion will remain. How would you like to proceed?
Mathematical Expression Editor
Tangent and normal vectors can help us make interesting parametric plots.
1 A sine curve on a circle
Suppose you wish to draw a sine curve on a circle like this:
How do you do this? Well, a general method for placing one curve along another is to
use unit tangent and unit normal vectors!
Plot the curve \(y= \sin (5x)\) “wrapped” around a circle
of radius \(3\).
where \(\vec {c}(t)\) draws the circle, and \(\unormal (t)\cdot \sin (5t)\) draws
the sine curve. Note, breaking \(\vec {f}\) in to components we have:
We can confirm our construction by making a graph:
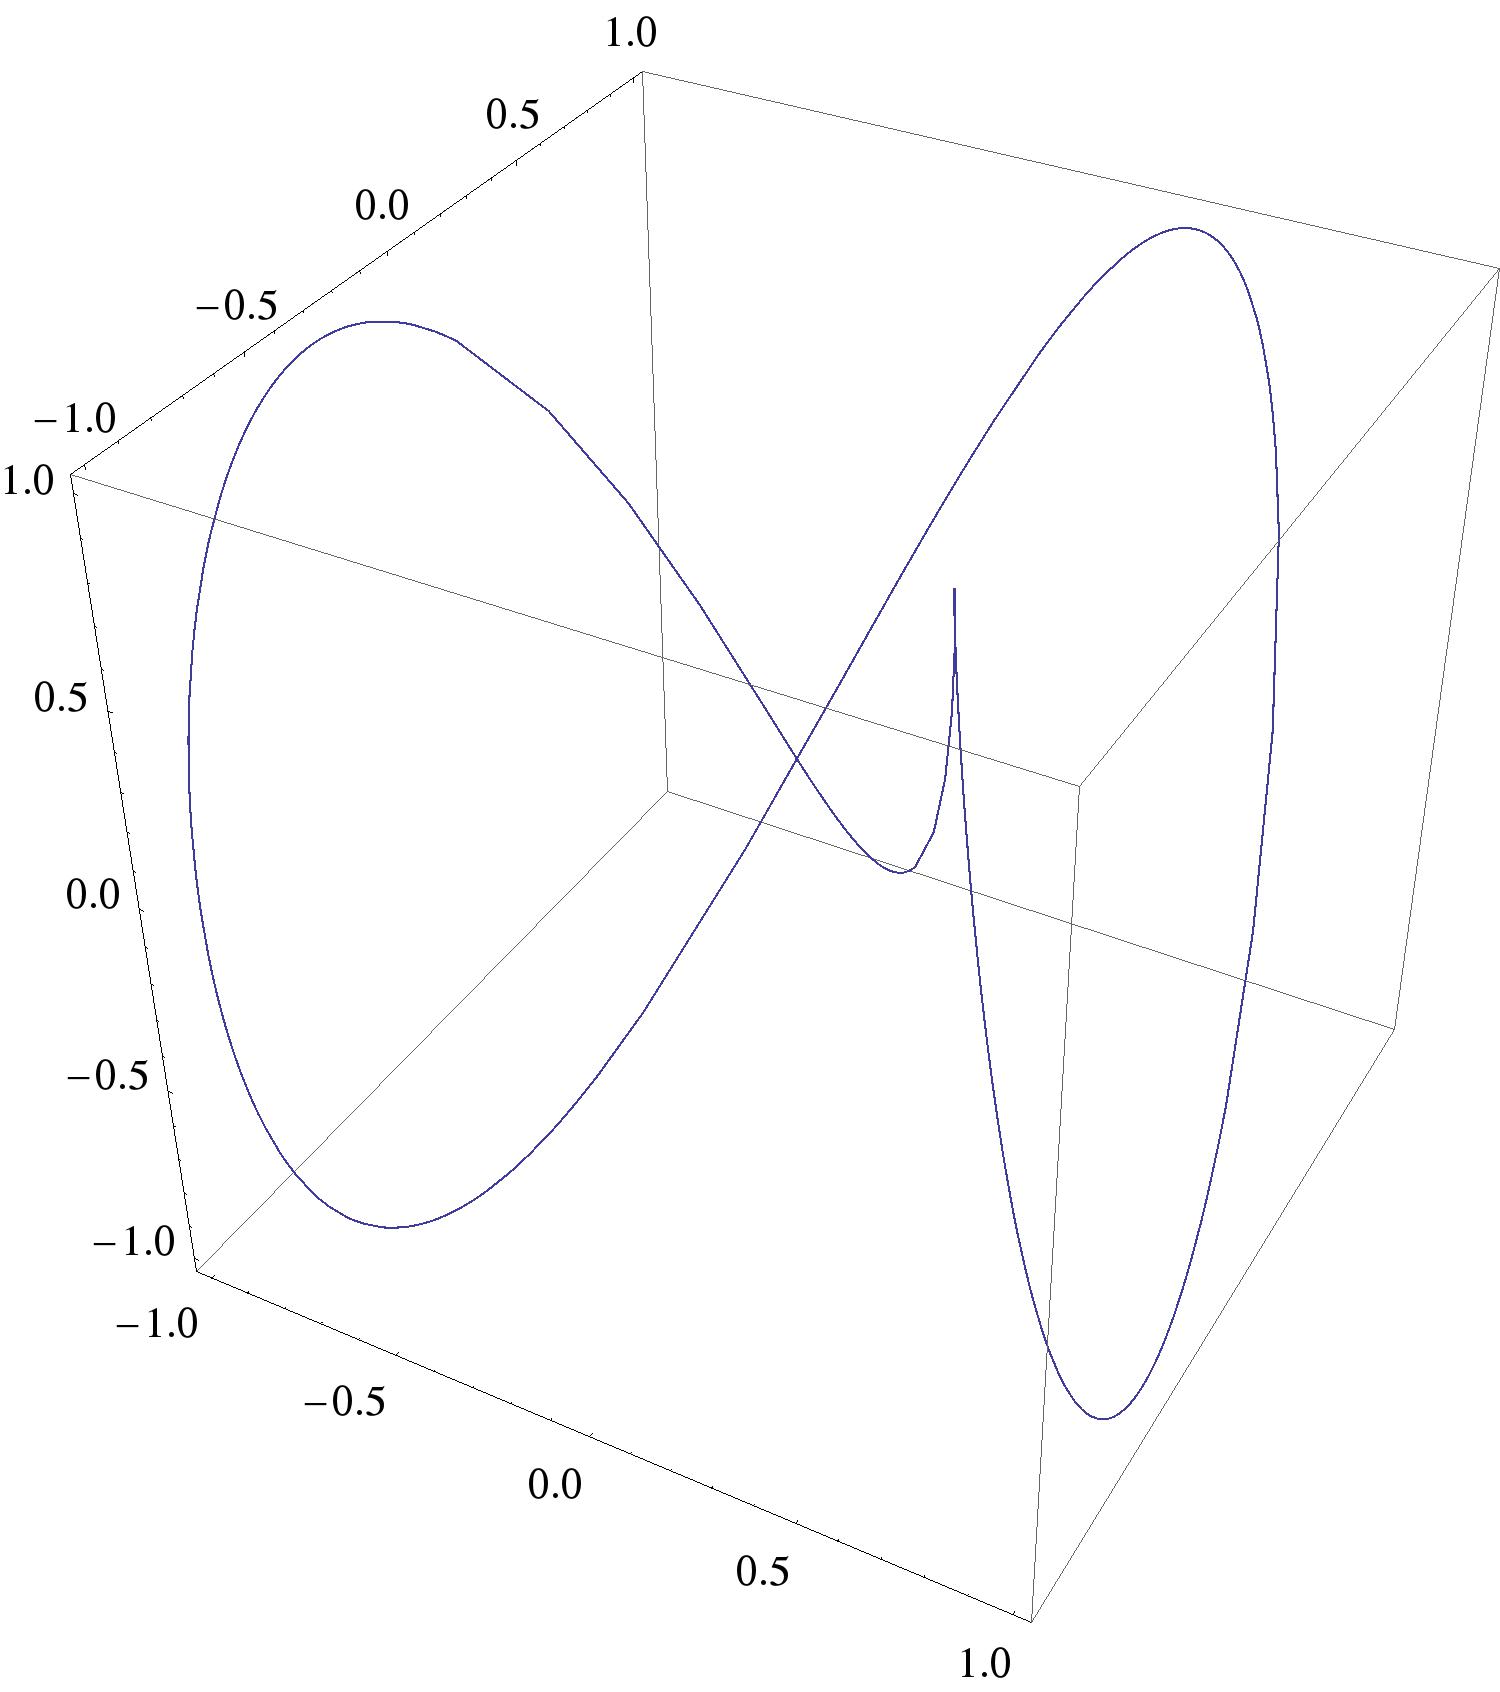
2 Thickening a curve
Suppose you have a vector-valued function \(\vec {f}:\R \to \R ^2\) that defines a curve in space, and you
want to build a parameterized surface that looks like a “thickened” version of the
curve. In other words, we want to convert a curve like
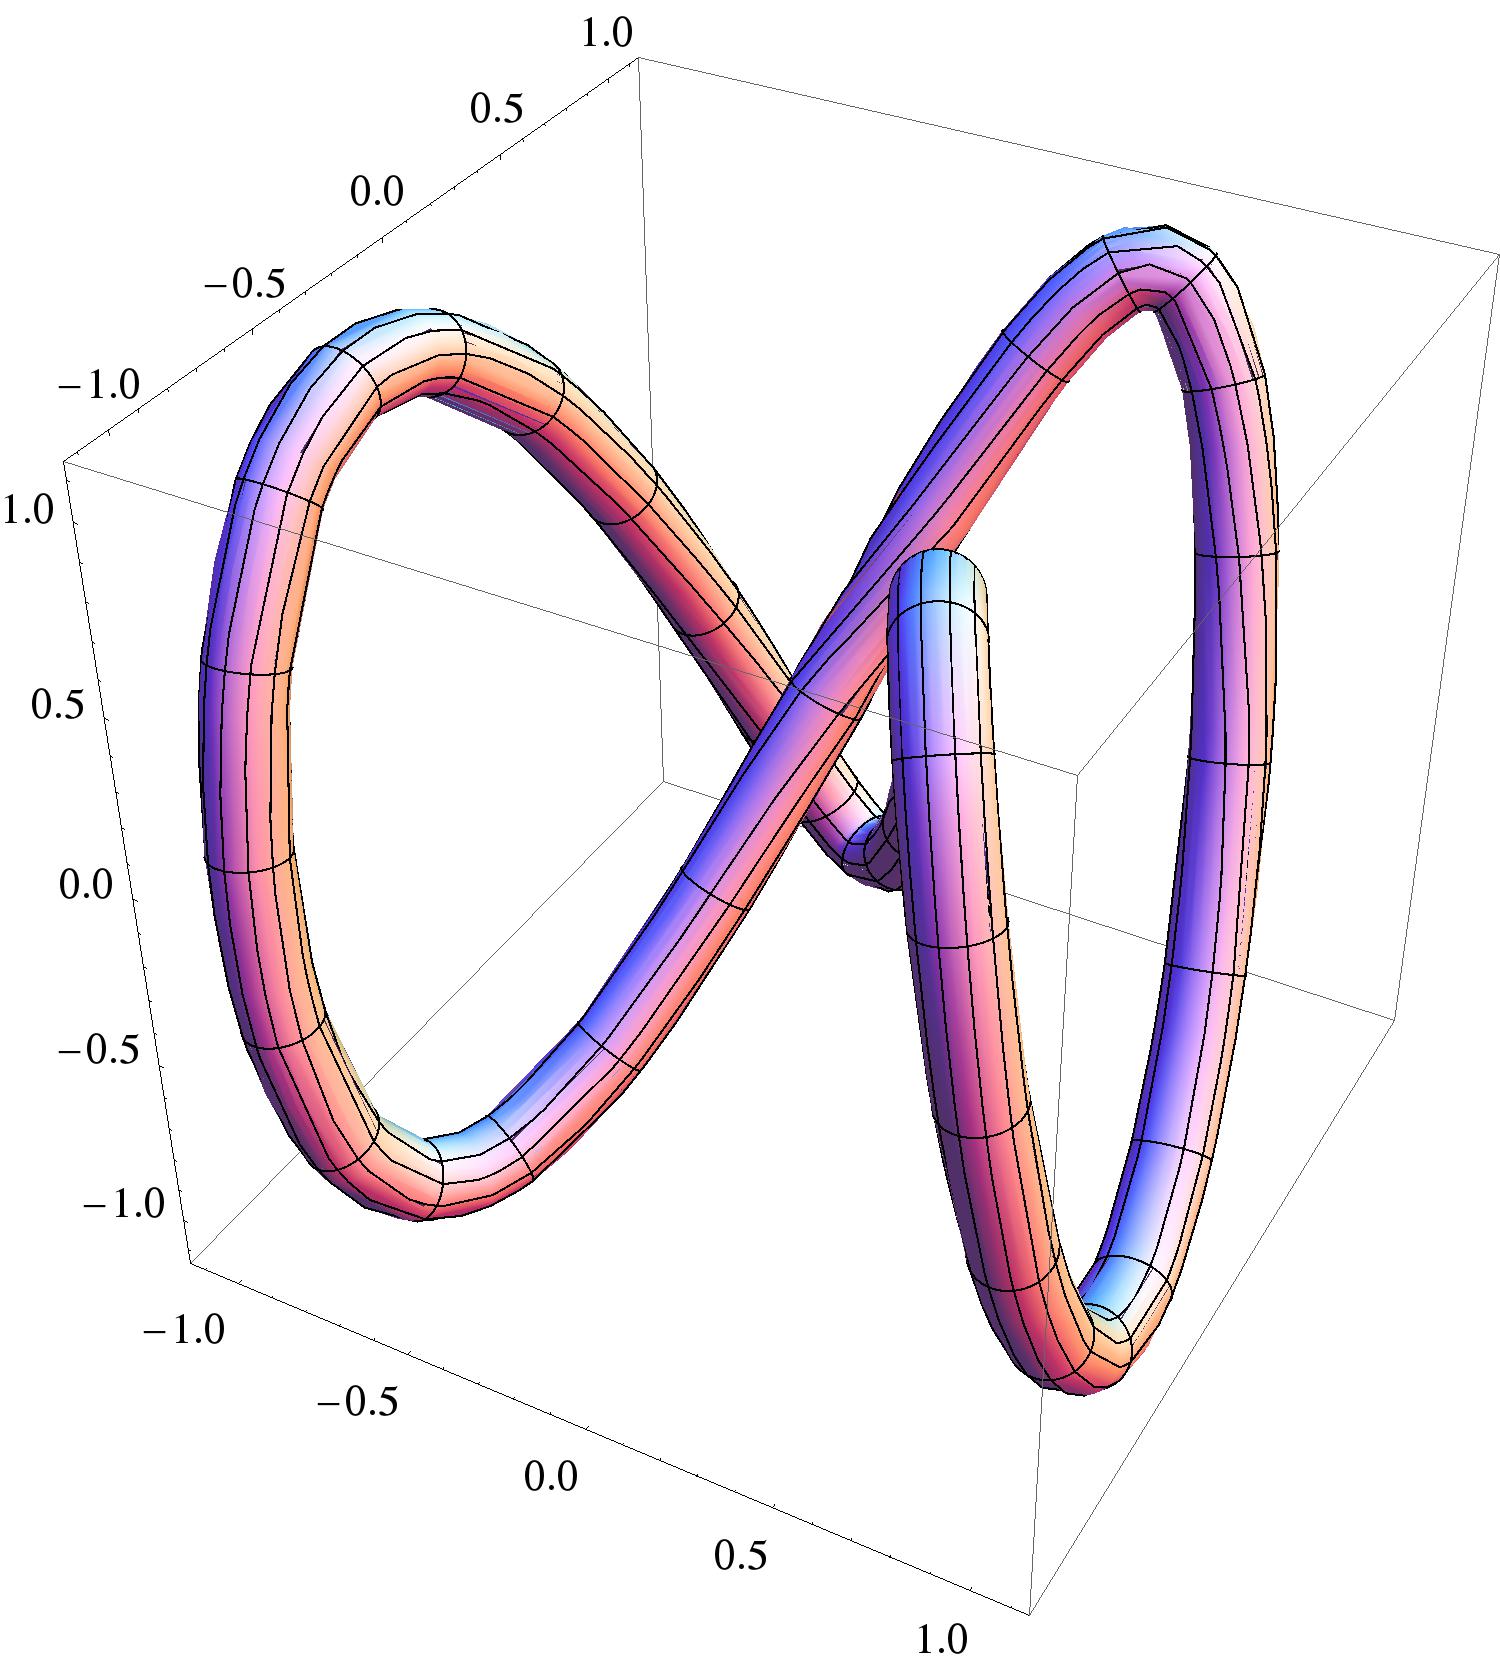
into a thickened “tube”
like
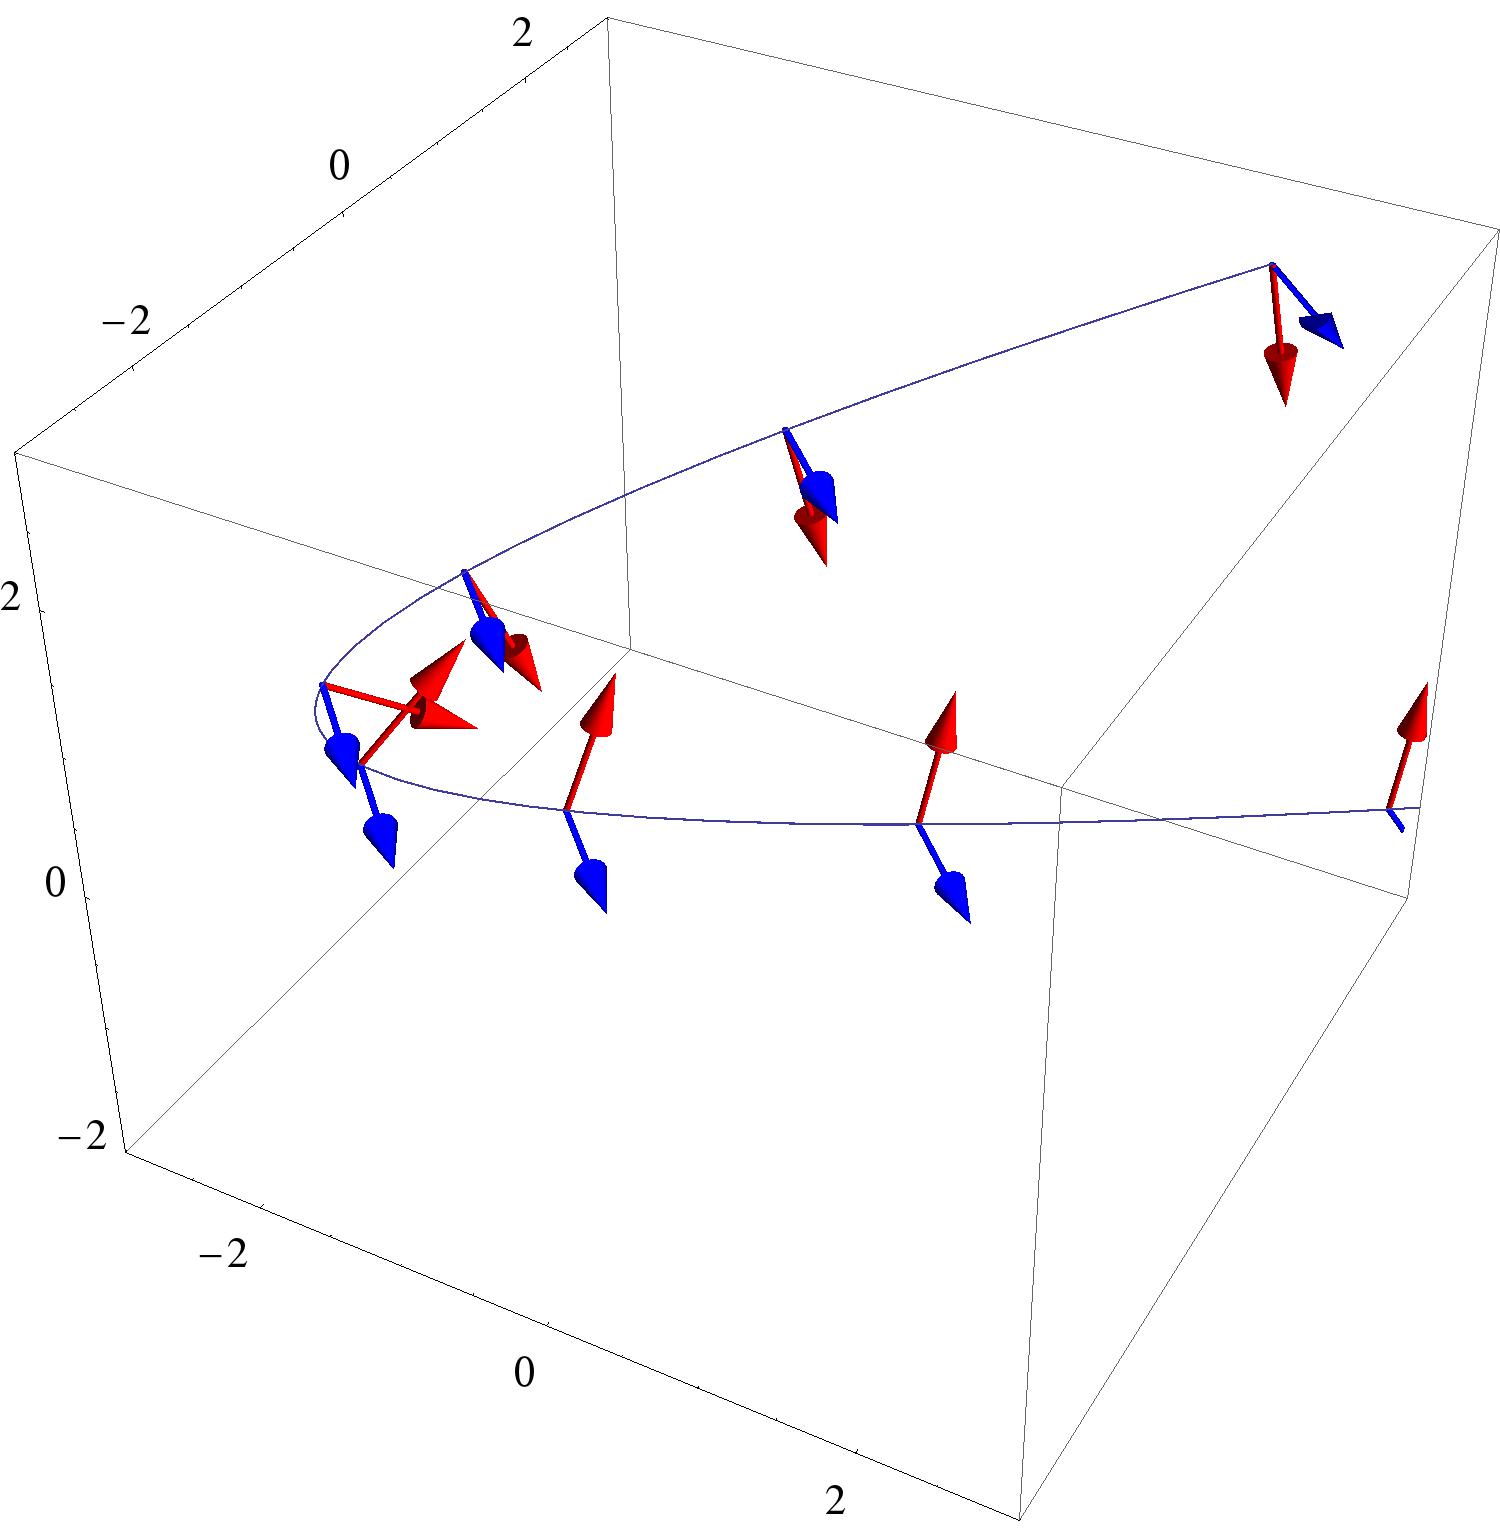
To plot a “tube” around a vector-valued function \(\vec {f}\), we need three handy vectors:
Here the function \(\vec {f}\) runs along the center of the tube, and \(\uvec {n}\) and \(\uvec {b}\) create a moving axis,
where a circle is drawn. Putting this all together we get a tube drawn around \(\vec {f}\). We
can check our work with the following interactive:
![[Picture]](digInParametricPlots.online-0ab95187ea87699e4a4b2d4cda0090b4.svg)
![[Picture]](digInParametricPlots.online-65a03d2ebba6b38853e557595ff7ca81.svg)