- What does a line passing through two points of a function’s graph represent?
- How does this inform our understanding of the function?
Introduction
We begin by recalling the definitions of average rate of change of a function and secant line to the graph of a function.
- the average rate of change of on is the quantity
- a secant line to the graph of is a line passing through two points and , with .
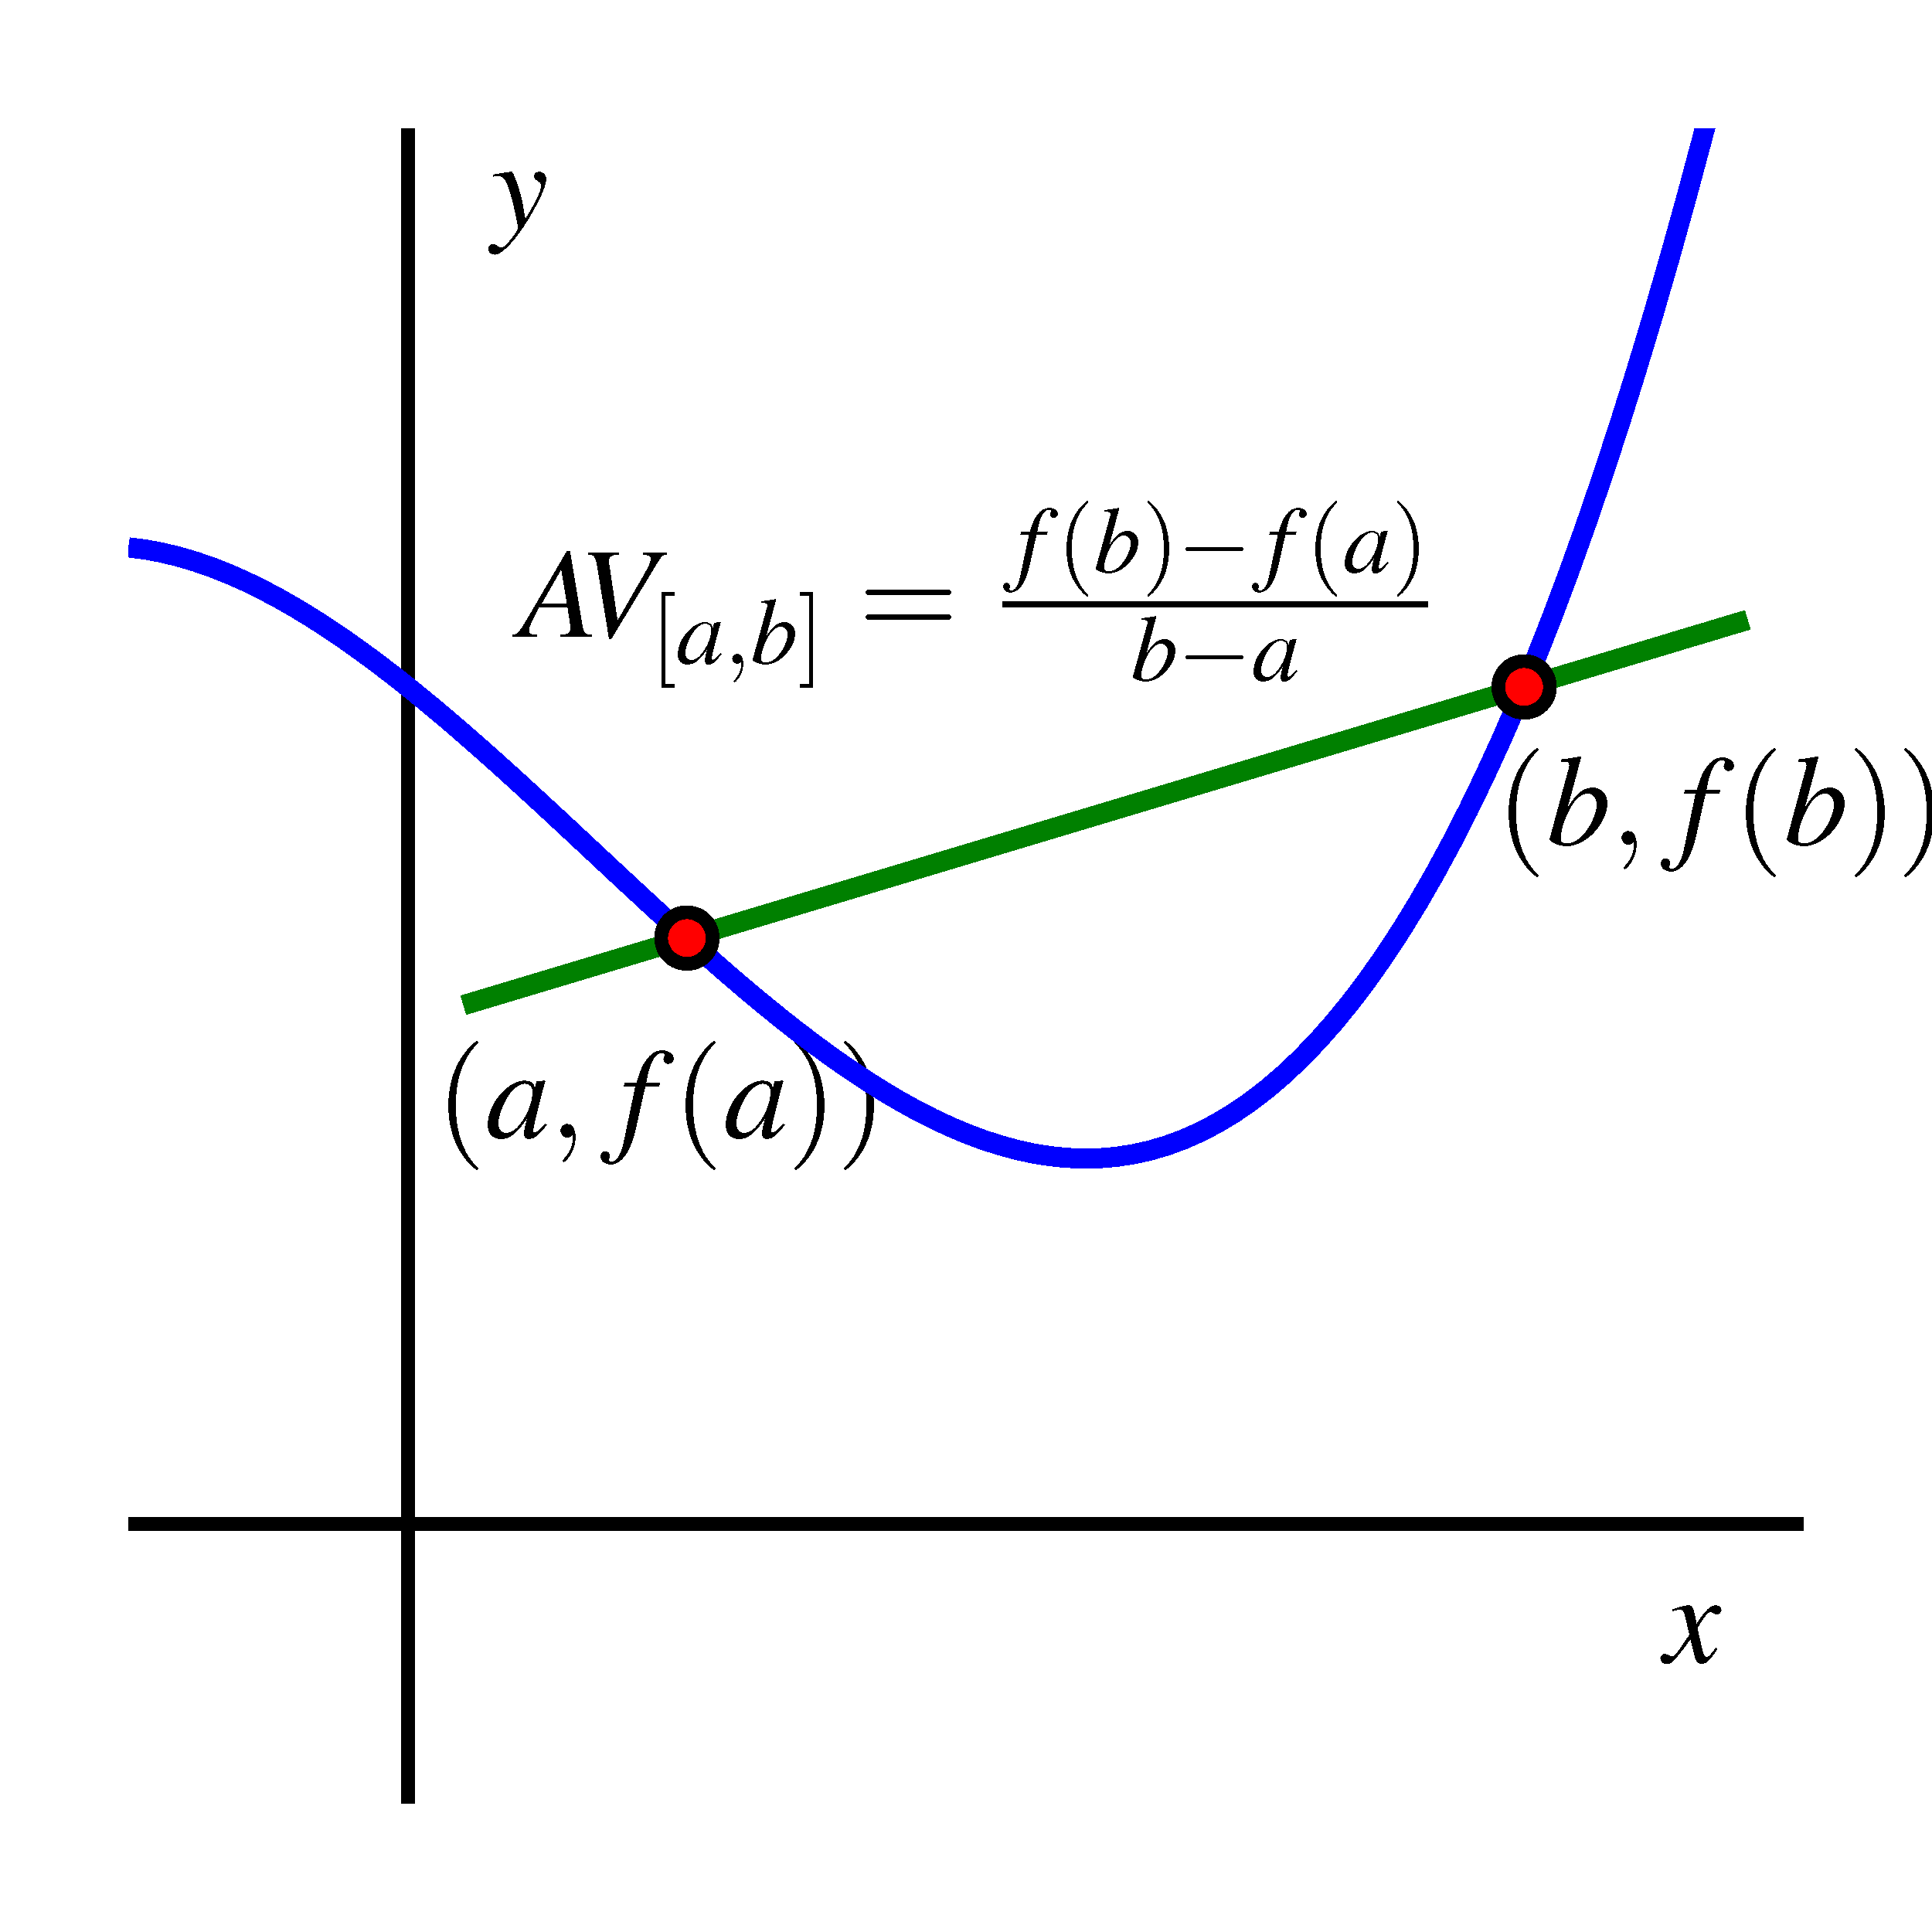
Recall: The slope of a secant line is the average rate of change of the function on the interval .
This is illustrated in the figure below, where the green line (between the red points on the graph) is the secant line of from to .

Recall that given two points and in the plane, with , we can find the equation of the line passing through them by using the slope (“rise-over-run”): Then the line equation is given by , simply because any given point in such a line must realize the same slope: Of course, one may also use the point instead of and consider the equation , as it describes the same line.
With this in place, we’ll focus on the situation where two such points lie on the graph of some function .
Definitions and examples
Recall: The slope of a secant line is the average rate of change of the function on the interval .
- a.
- , points and .
- b.
- , points and .
This time, we have that and also that , so the points given were in fact and . Hence the slope of the secant line is so the line equation boils down to . Again, you should see not as a single value of , but as a line equation for which it just happens that does not appear — thus describing a horizontal line.
- c.
- , points and .
Now, we have and , so the points given were and . The slope these points determine is so we obtain , which can be rewritten as . This is not a coincidence! The secant line to the graph of a line must be the line itself. This is because a line is determined by two points, and since both the original line and the secant line must share the two given points, they must be, in fact, equal.