You are about to erase your work on this activity. Are you sure you want to do this?
Updated Version Available
There is an updated version of this activity. If you update to the most recent version of this activity, then your current progress on this activity will be erased. Regardless, your record of completion will remain. How would you like to proceed?
Mathematical Expression Editor
Motivating Questions
What are the sine and cosine functions and how do they arise from a point
traversing the unit circle?
What important properties do the sine and cosine functions share?
In the last section, we saw how tracking the height of a point that is traversing a
circle generates a periodic function. Previously, we also identified a collection of
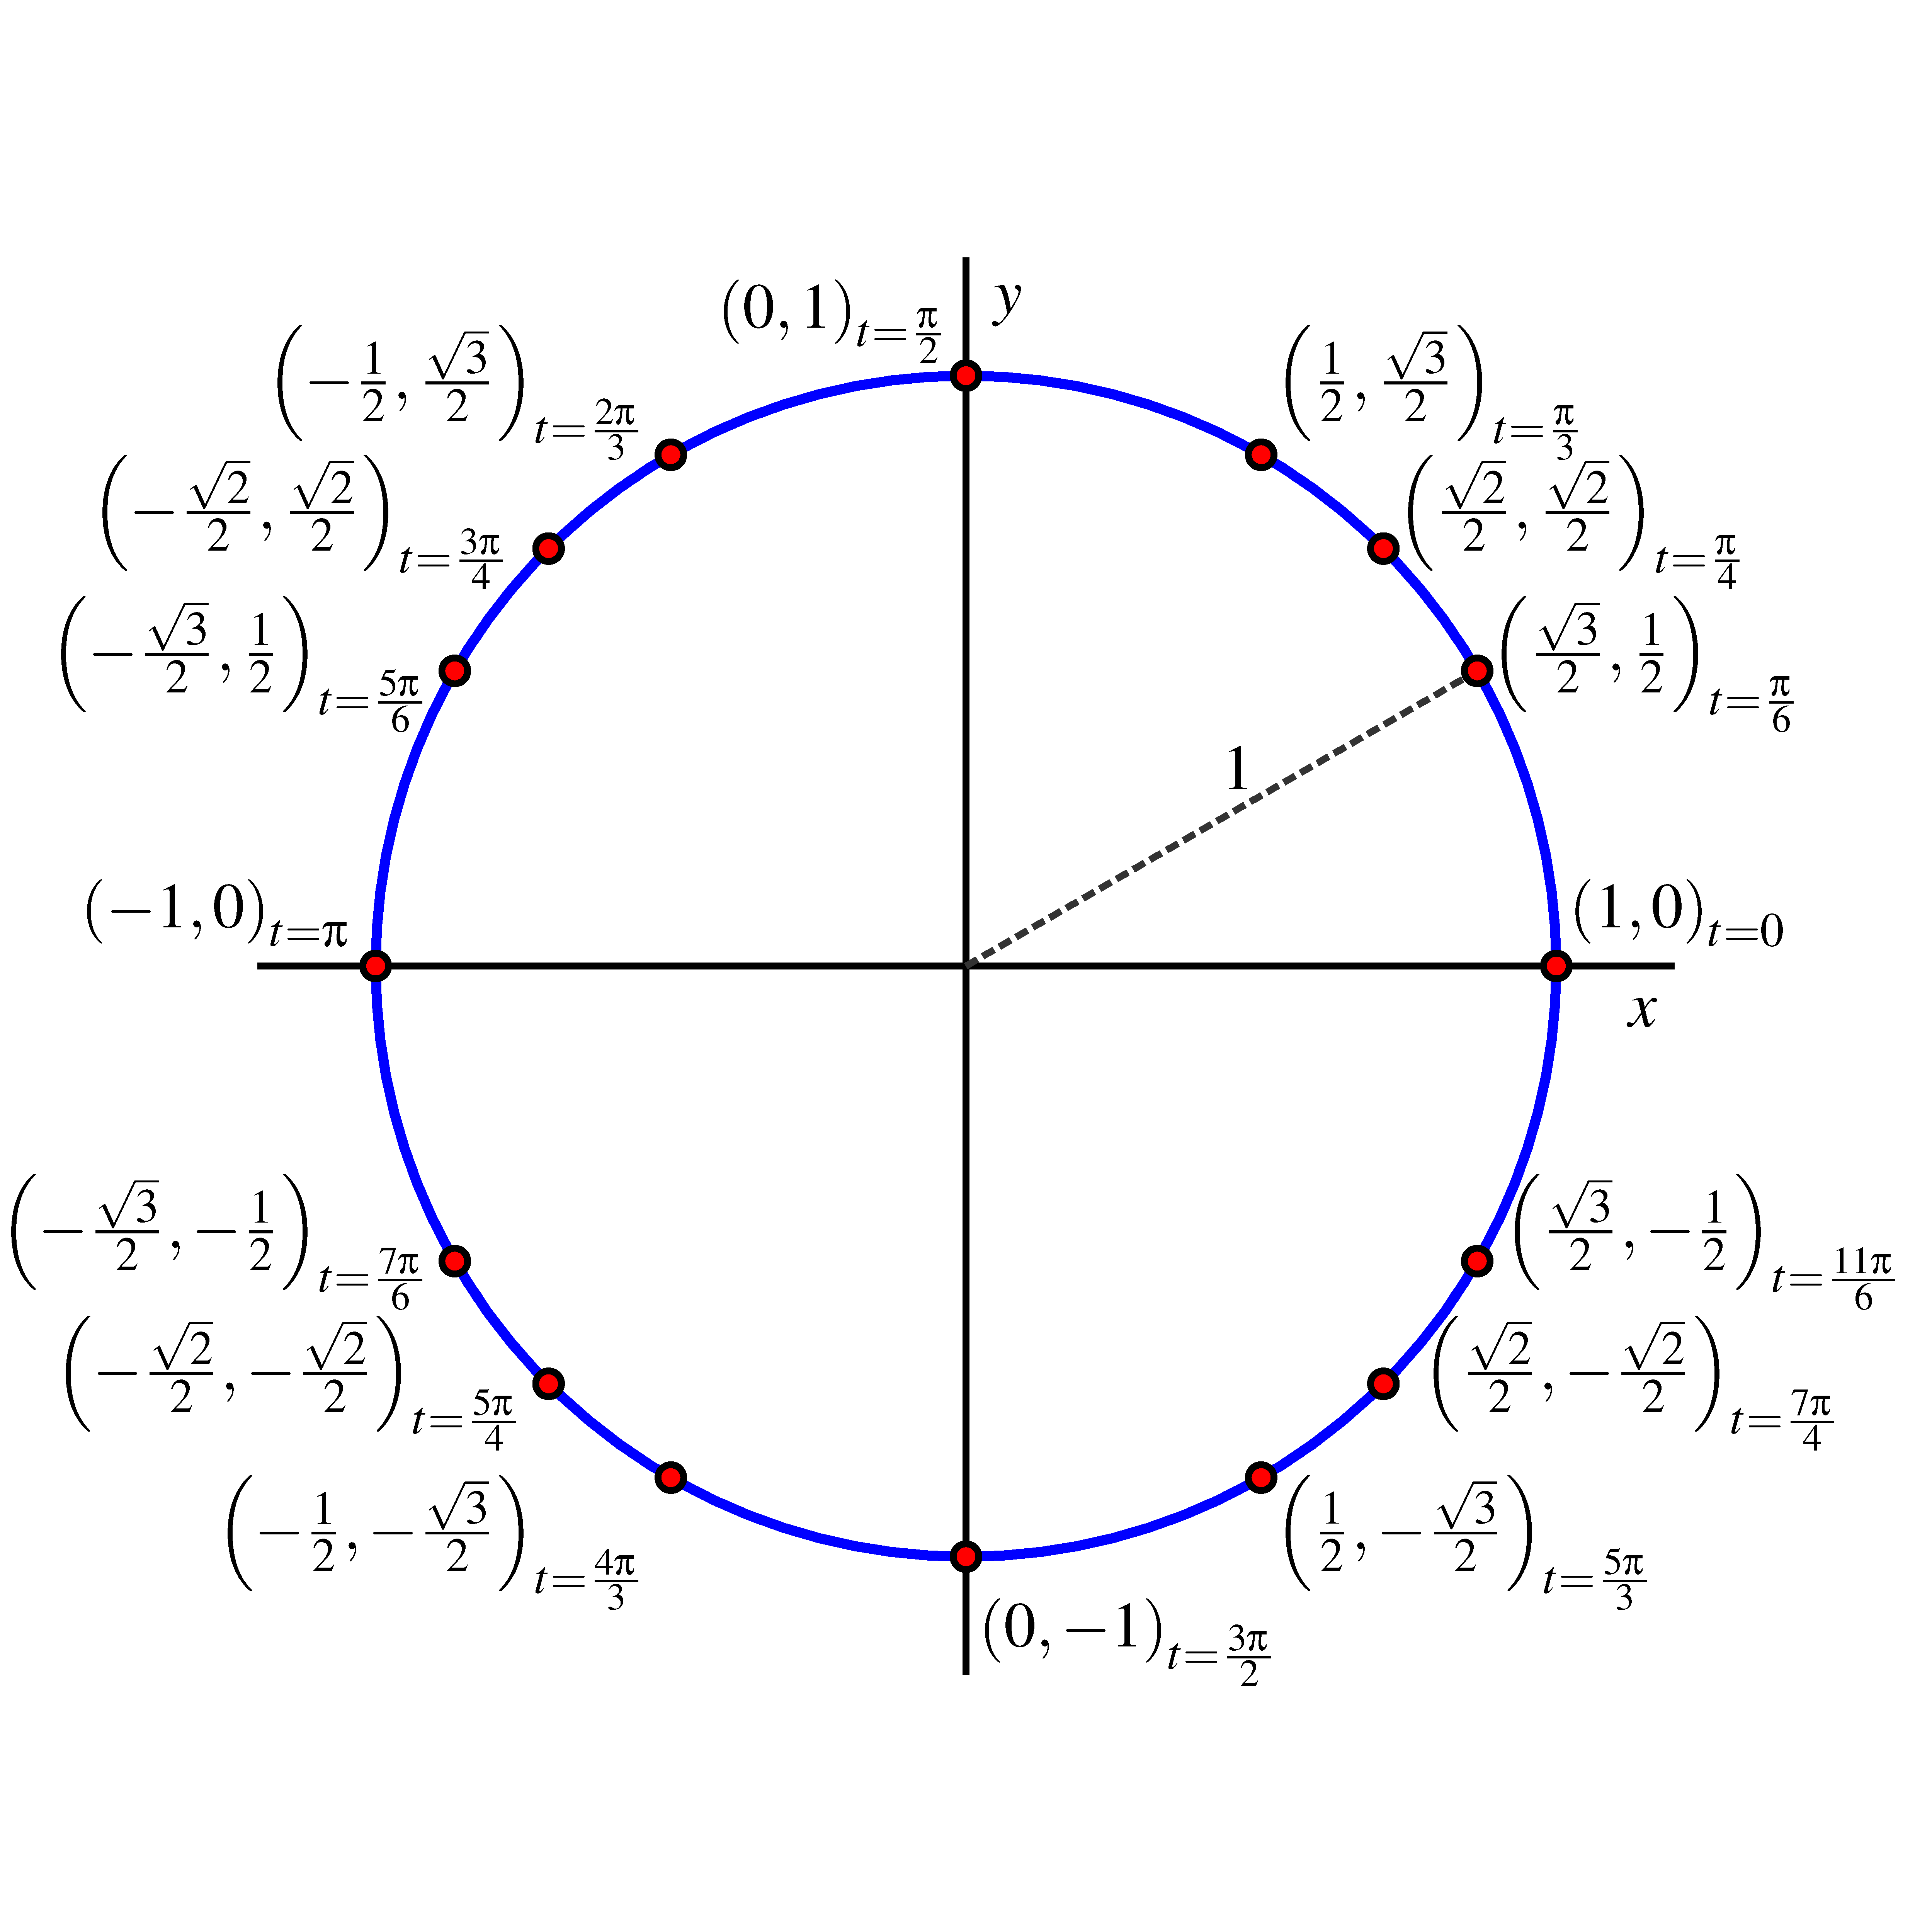
special points on the unit circle.
You can also use the Desmos file:
If we consider the unit circle, start at , and traverse the circle counterclockwise, we
may view the height, , of the traversing point as a function of the angle, , in radians.
From there, we can plot the resulting ordered pairs and connect them to generate
the circular function pictured below.
a.
What is the exact value of ? of ?
b.
Complete the following table with the exact values of that correspond to
the stated inputs.
c.
What is the exact value of ? of ?
d.
Give four different values of for which .
The Definition of the Sine Function
The circular function that tracks the height of a point on the unit circle traversing
counterclockwise from as a function of the corresponding central angle (in radians) is
one of the most important functions in mathematics. As such, we give the function a
name: the sine function.
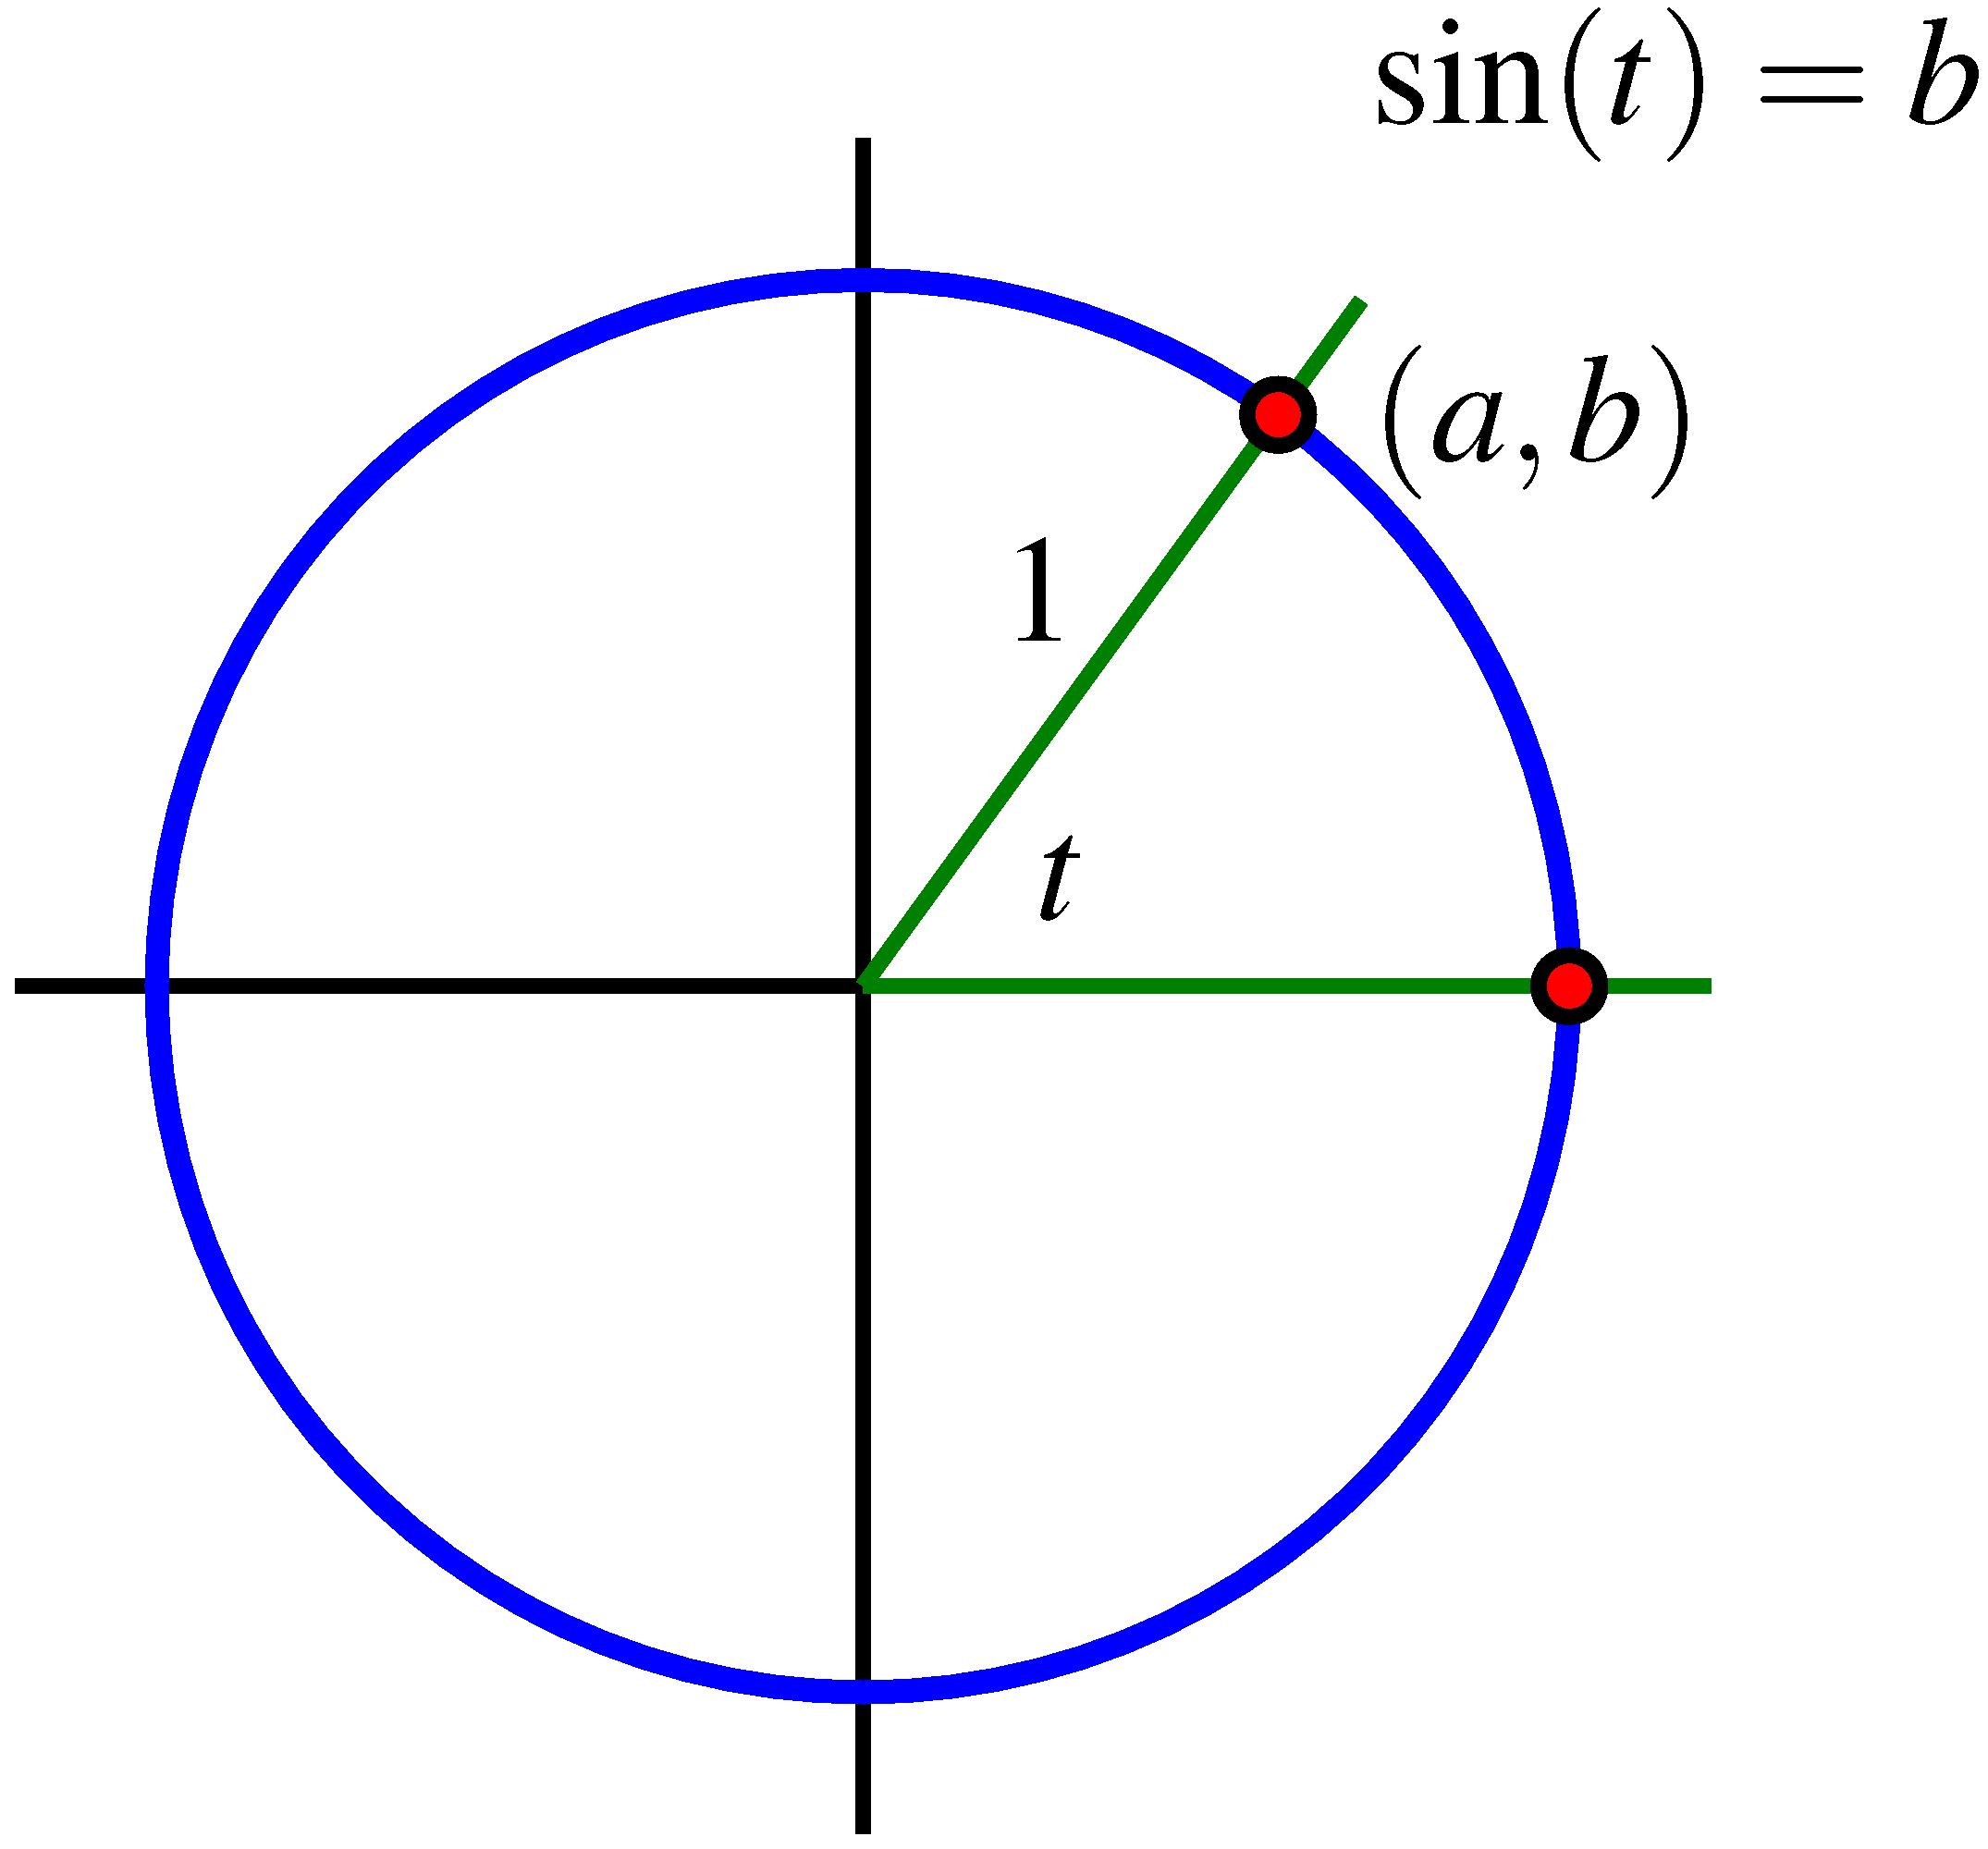
Given a central angle in the unit circle that measures radians and that
intersects the circle at both and , we define the sine of , denoted , by the rule
Because of the correspondence between radian angle measure and distance traversed
on the unit circle, we can also think of as identifying the -coordinate of the point
after it has traveled units counterclockwise along the circle from . Note
particularly that we can consider the sine of negative inputs: for instance,
.
Based on our earlier work with the unit circle, we know many different exact values
of the sine function, and summarize these in in the table below:
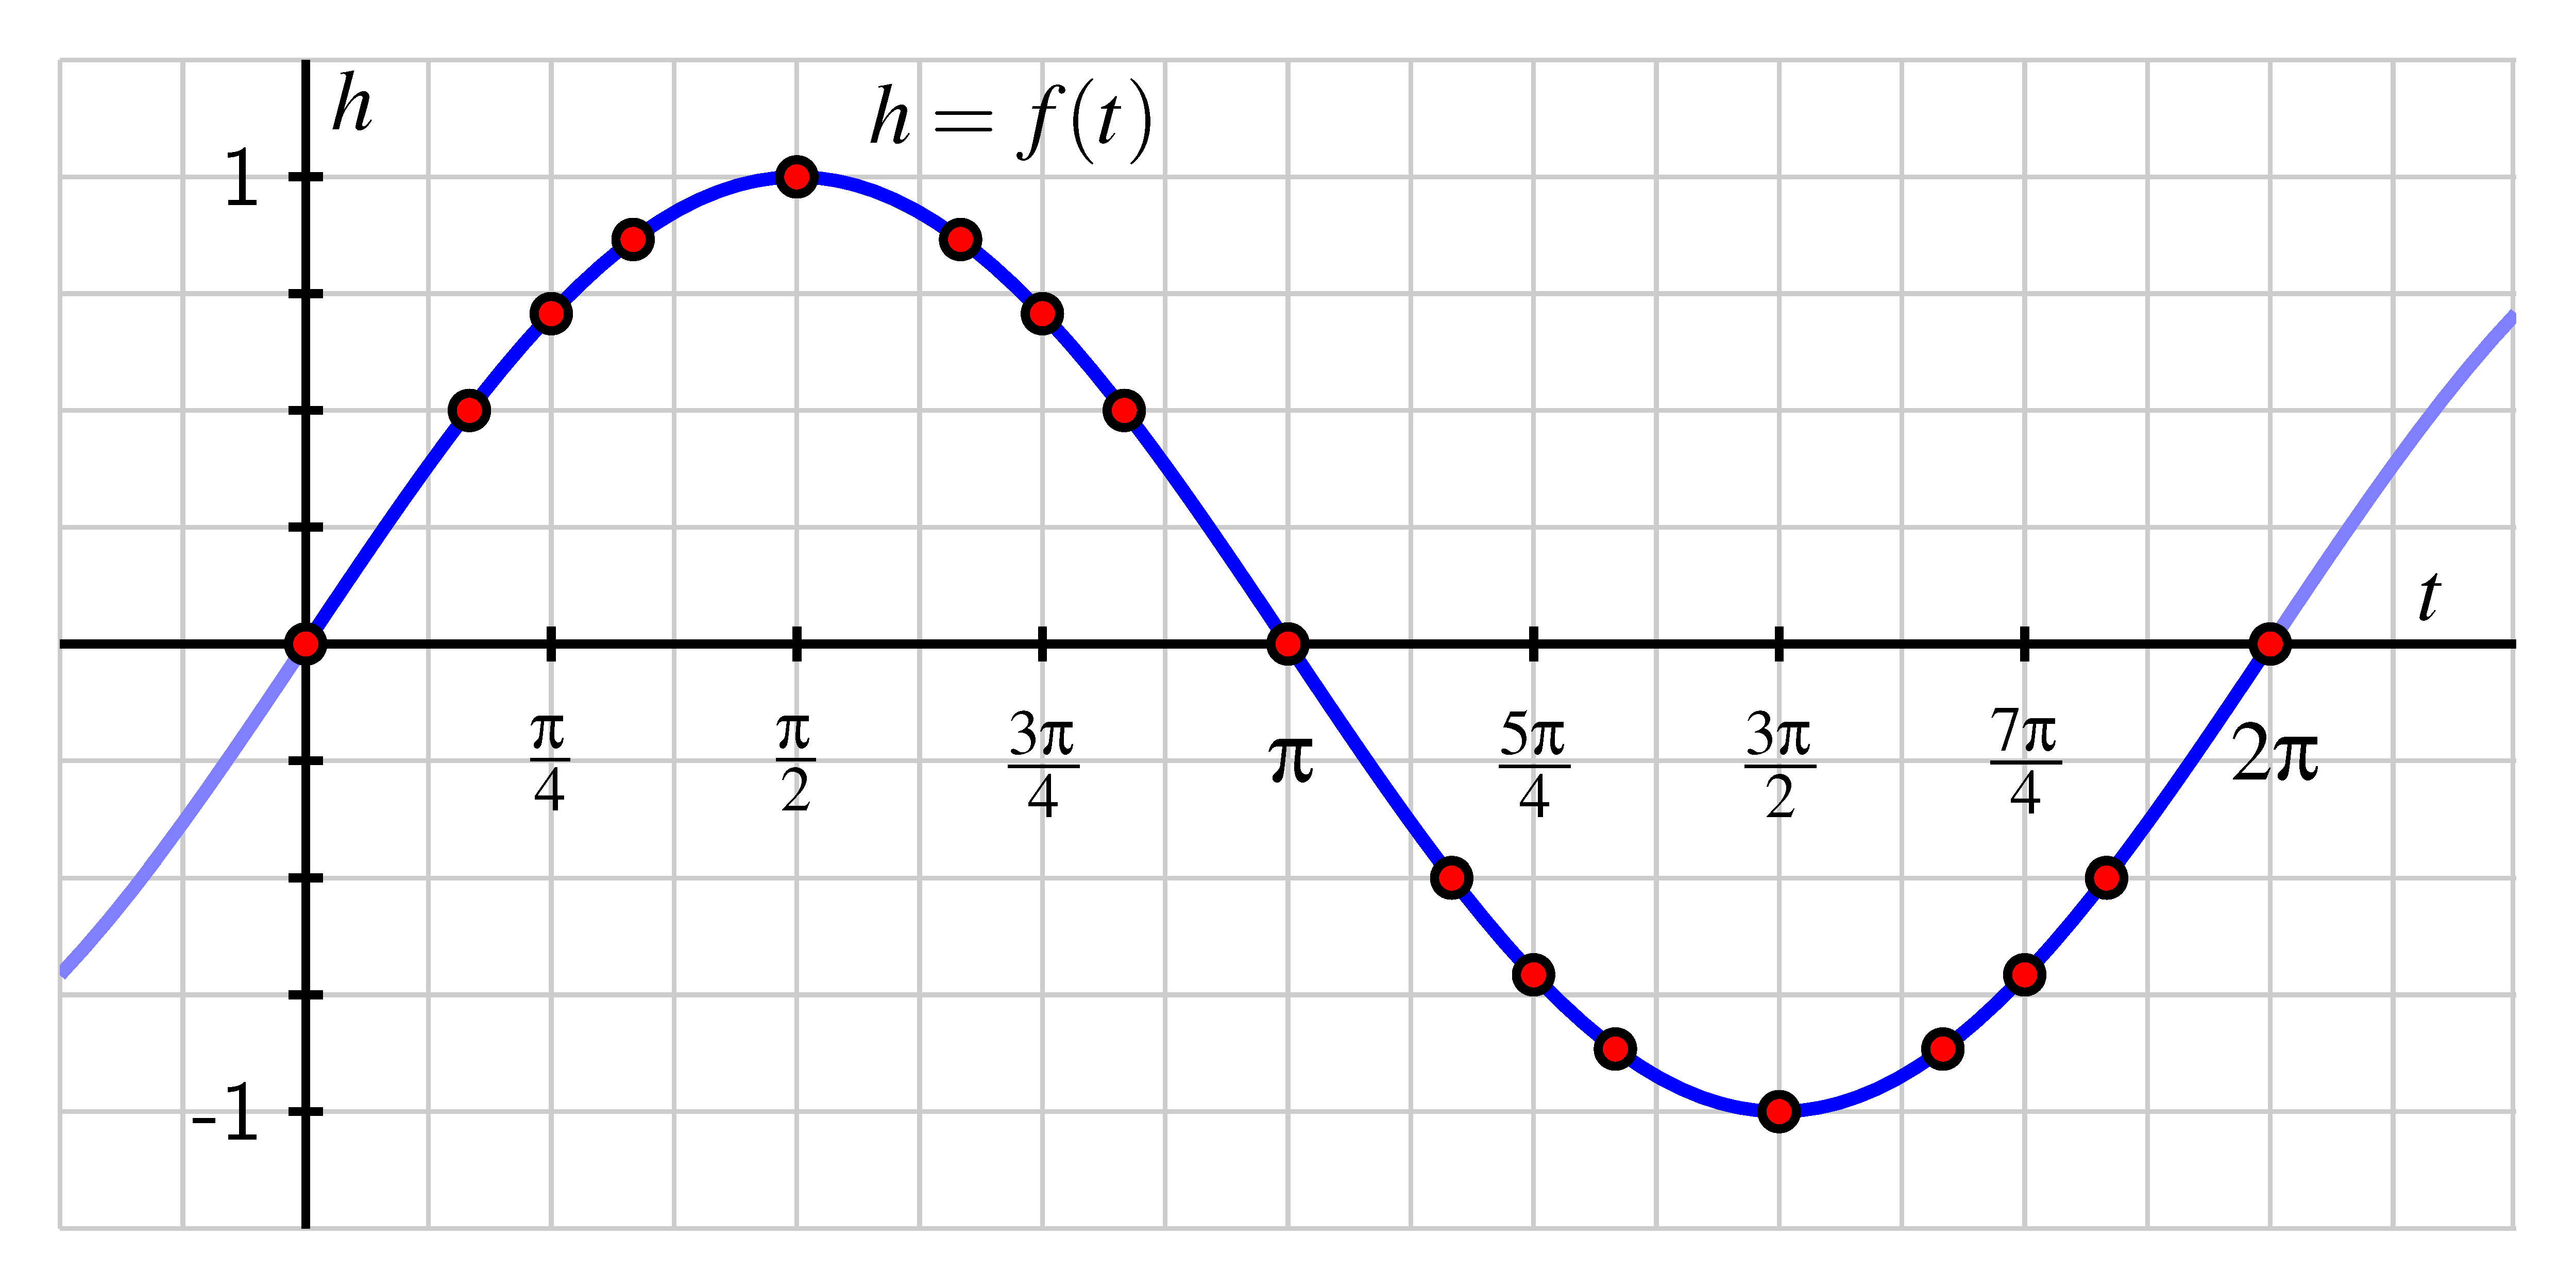
Moreover, if we now plot these points in the usual way, we get the familiar circular
wave function that comes from tracking the height of a point traversing a circle. We
often call this graph the sine wave.
At https://www.desmos.com/calculator/f9foqx24ct you can explore and
investigate a helpful Desmos animation that shows how this motion around the circle
generates the sine graph.
The Definition of the Cosine Function
Given any central angle of radian measure in the unit circle with one side passing
through the point , the angle generates a unique point that lies on the circle. Just as
we can view the -coordinate as a function of , the -coordinate is likewise a function of
. We therefore make the following definition.
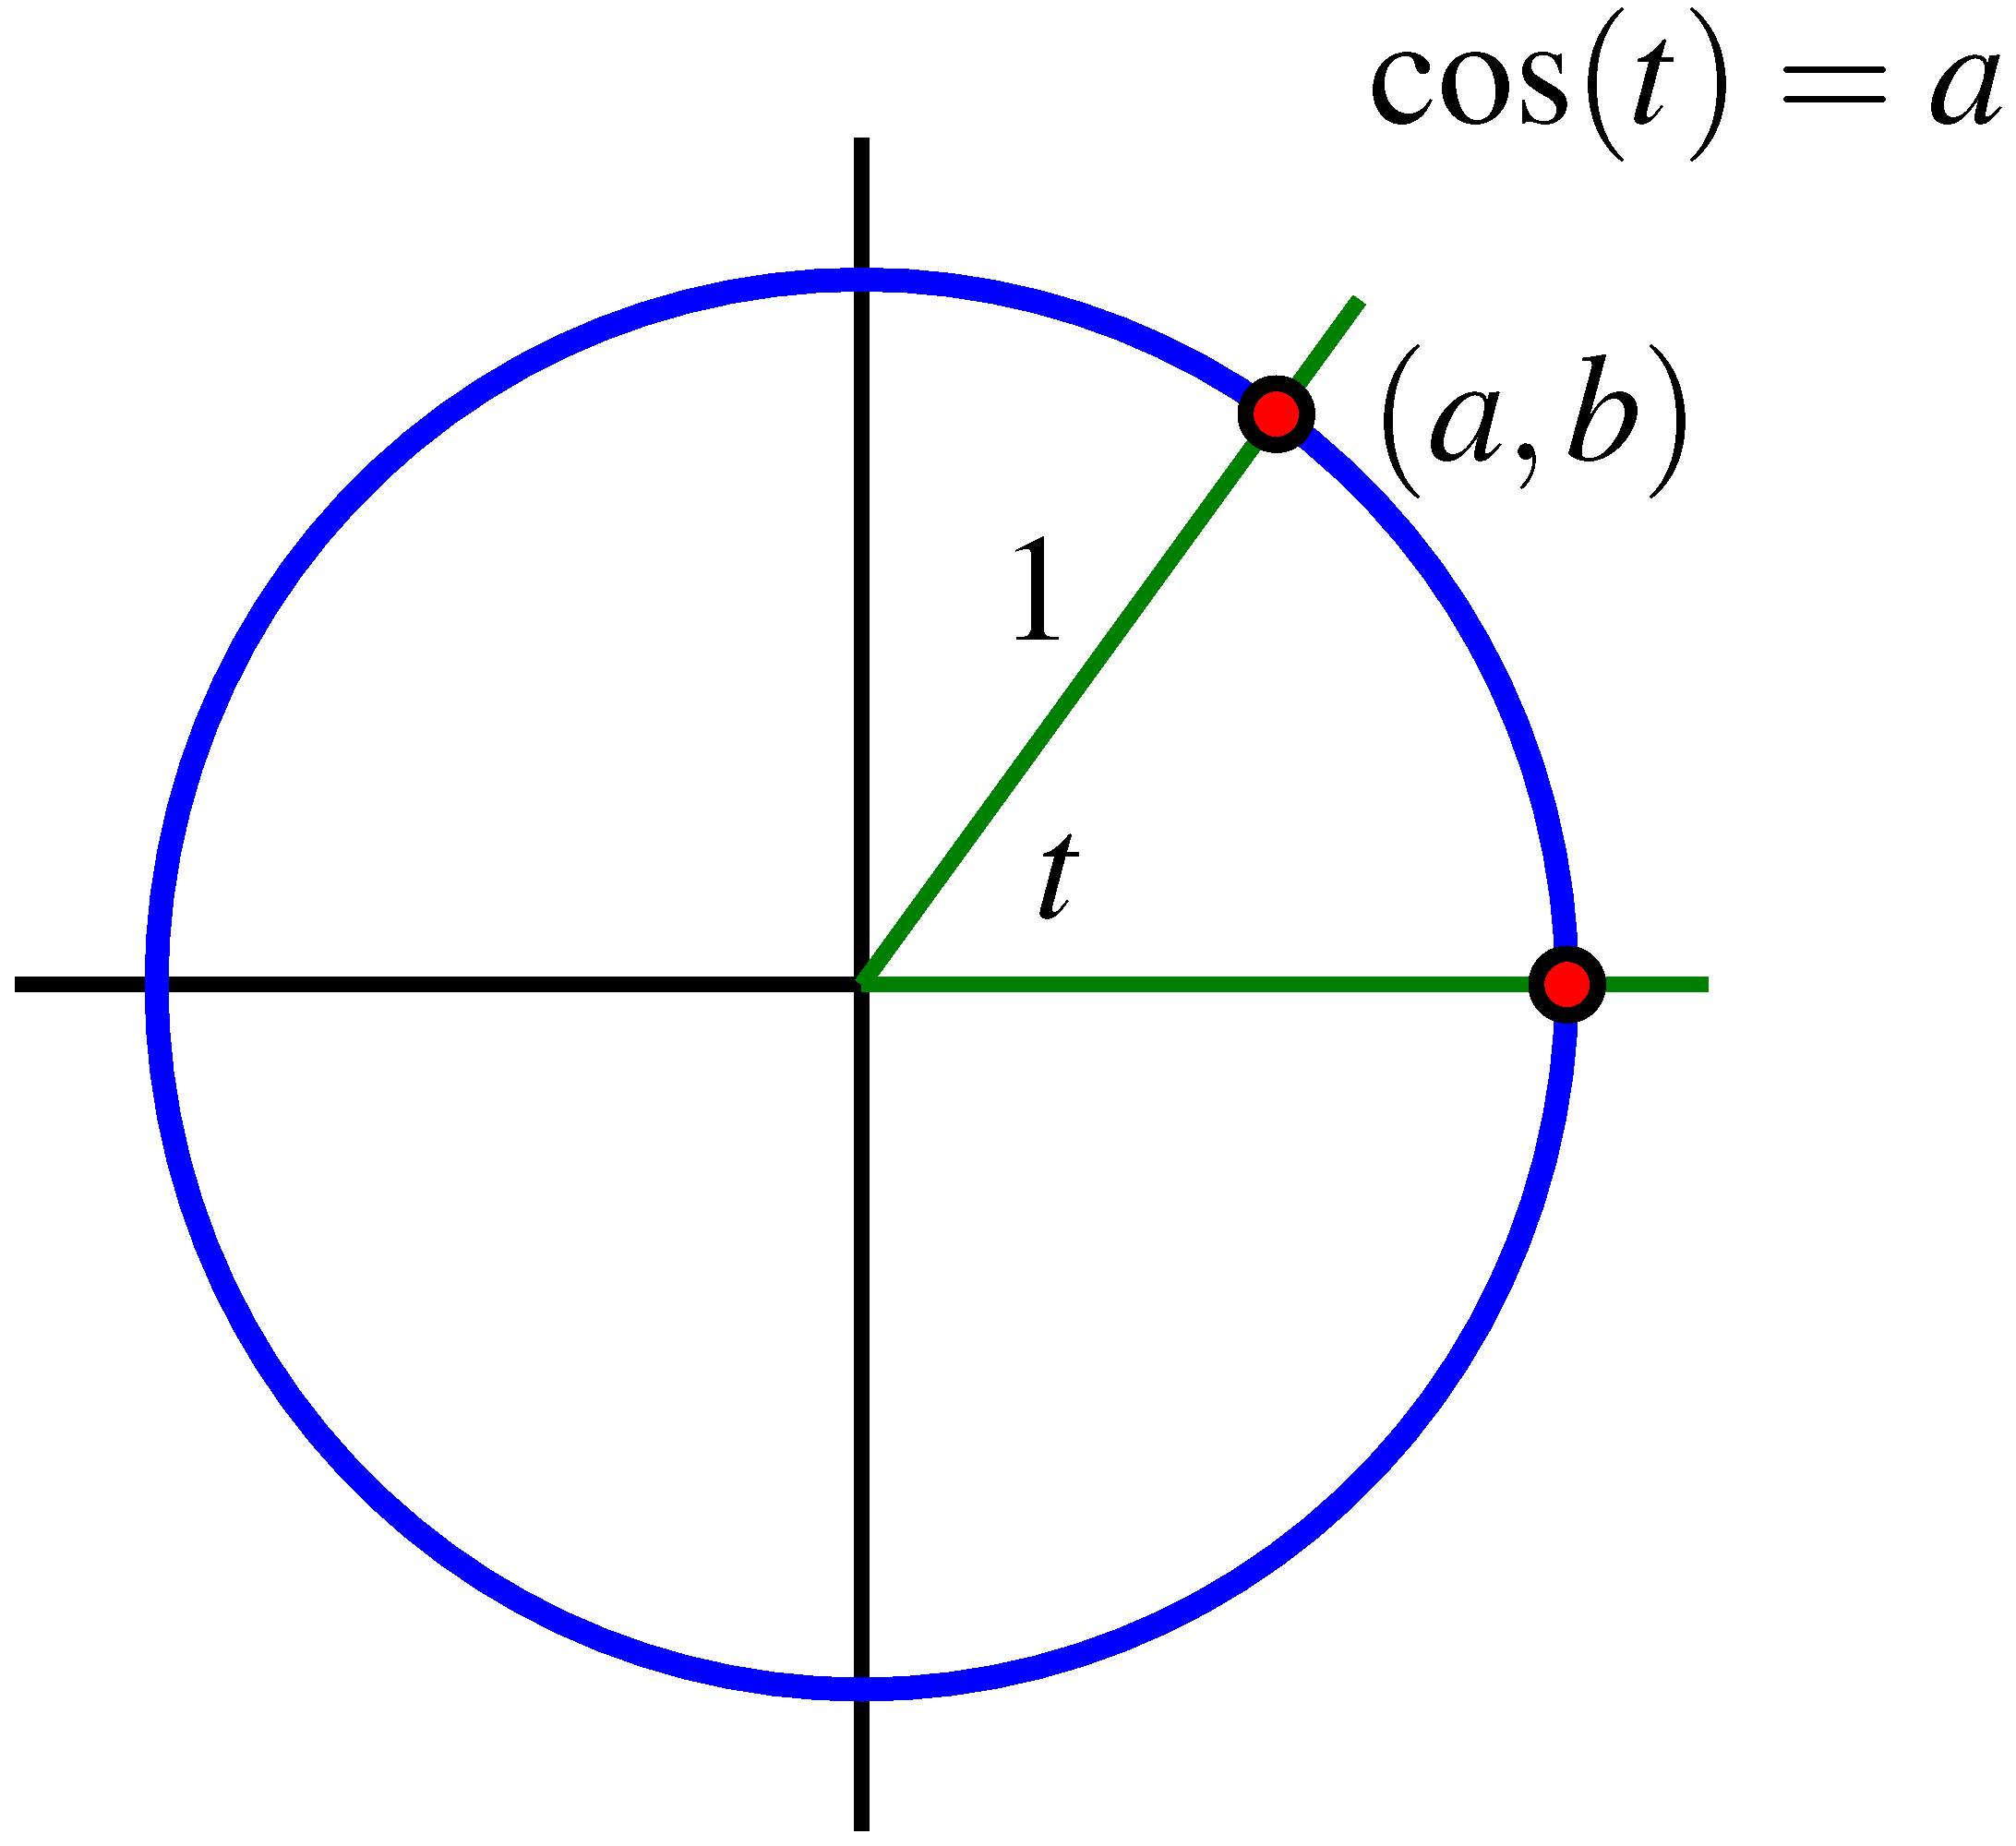
Given a central angle in the unit circle that measures radians and that intersects
the circle at both and , we define the cosine of , denoted , by the rule
Again because of the correspondence between the radian measure of an angle and arc
length along the unit circle, we can view the value of as tracking the -coordinate of a
point traversing the unit circle clockwise a distance of units along the circle
from . We now use the data and information we have developed about the
unit circle to build a table of values of as well as a graph of the curve it
generates.
Let be the function that tracks the -coordinate of a point traversing the unit circle
counterclockwise from . That is, . Use the information we know about the unit circle
to respond to the following questions.
a.
What is the exact value of ? of ? ?
b.
Complete the following table with the exact values of that correspond to
the stated inputs.
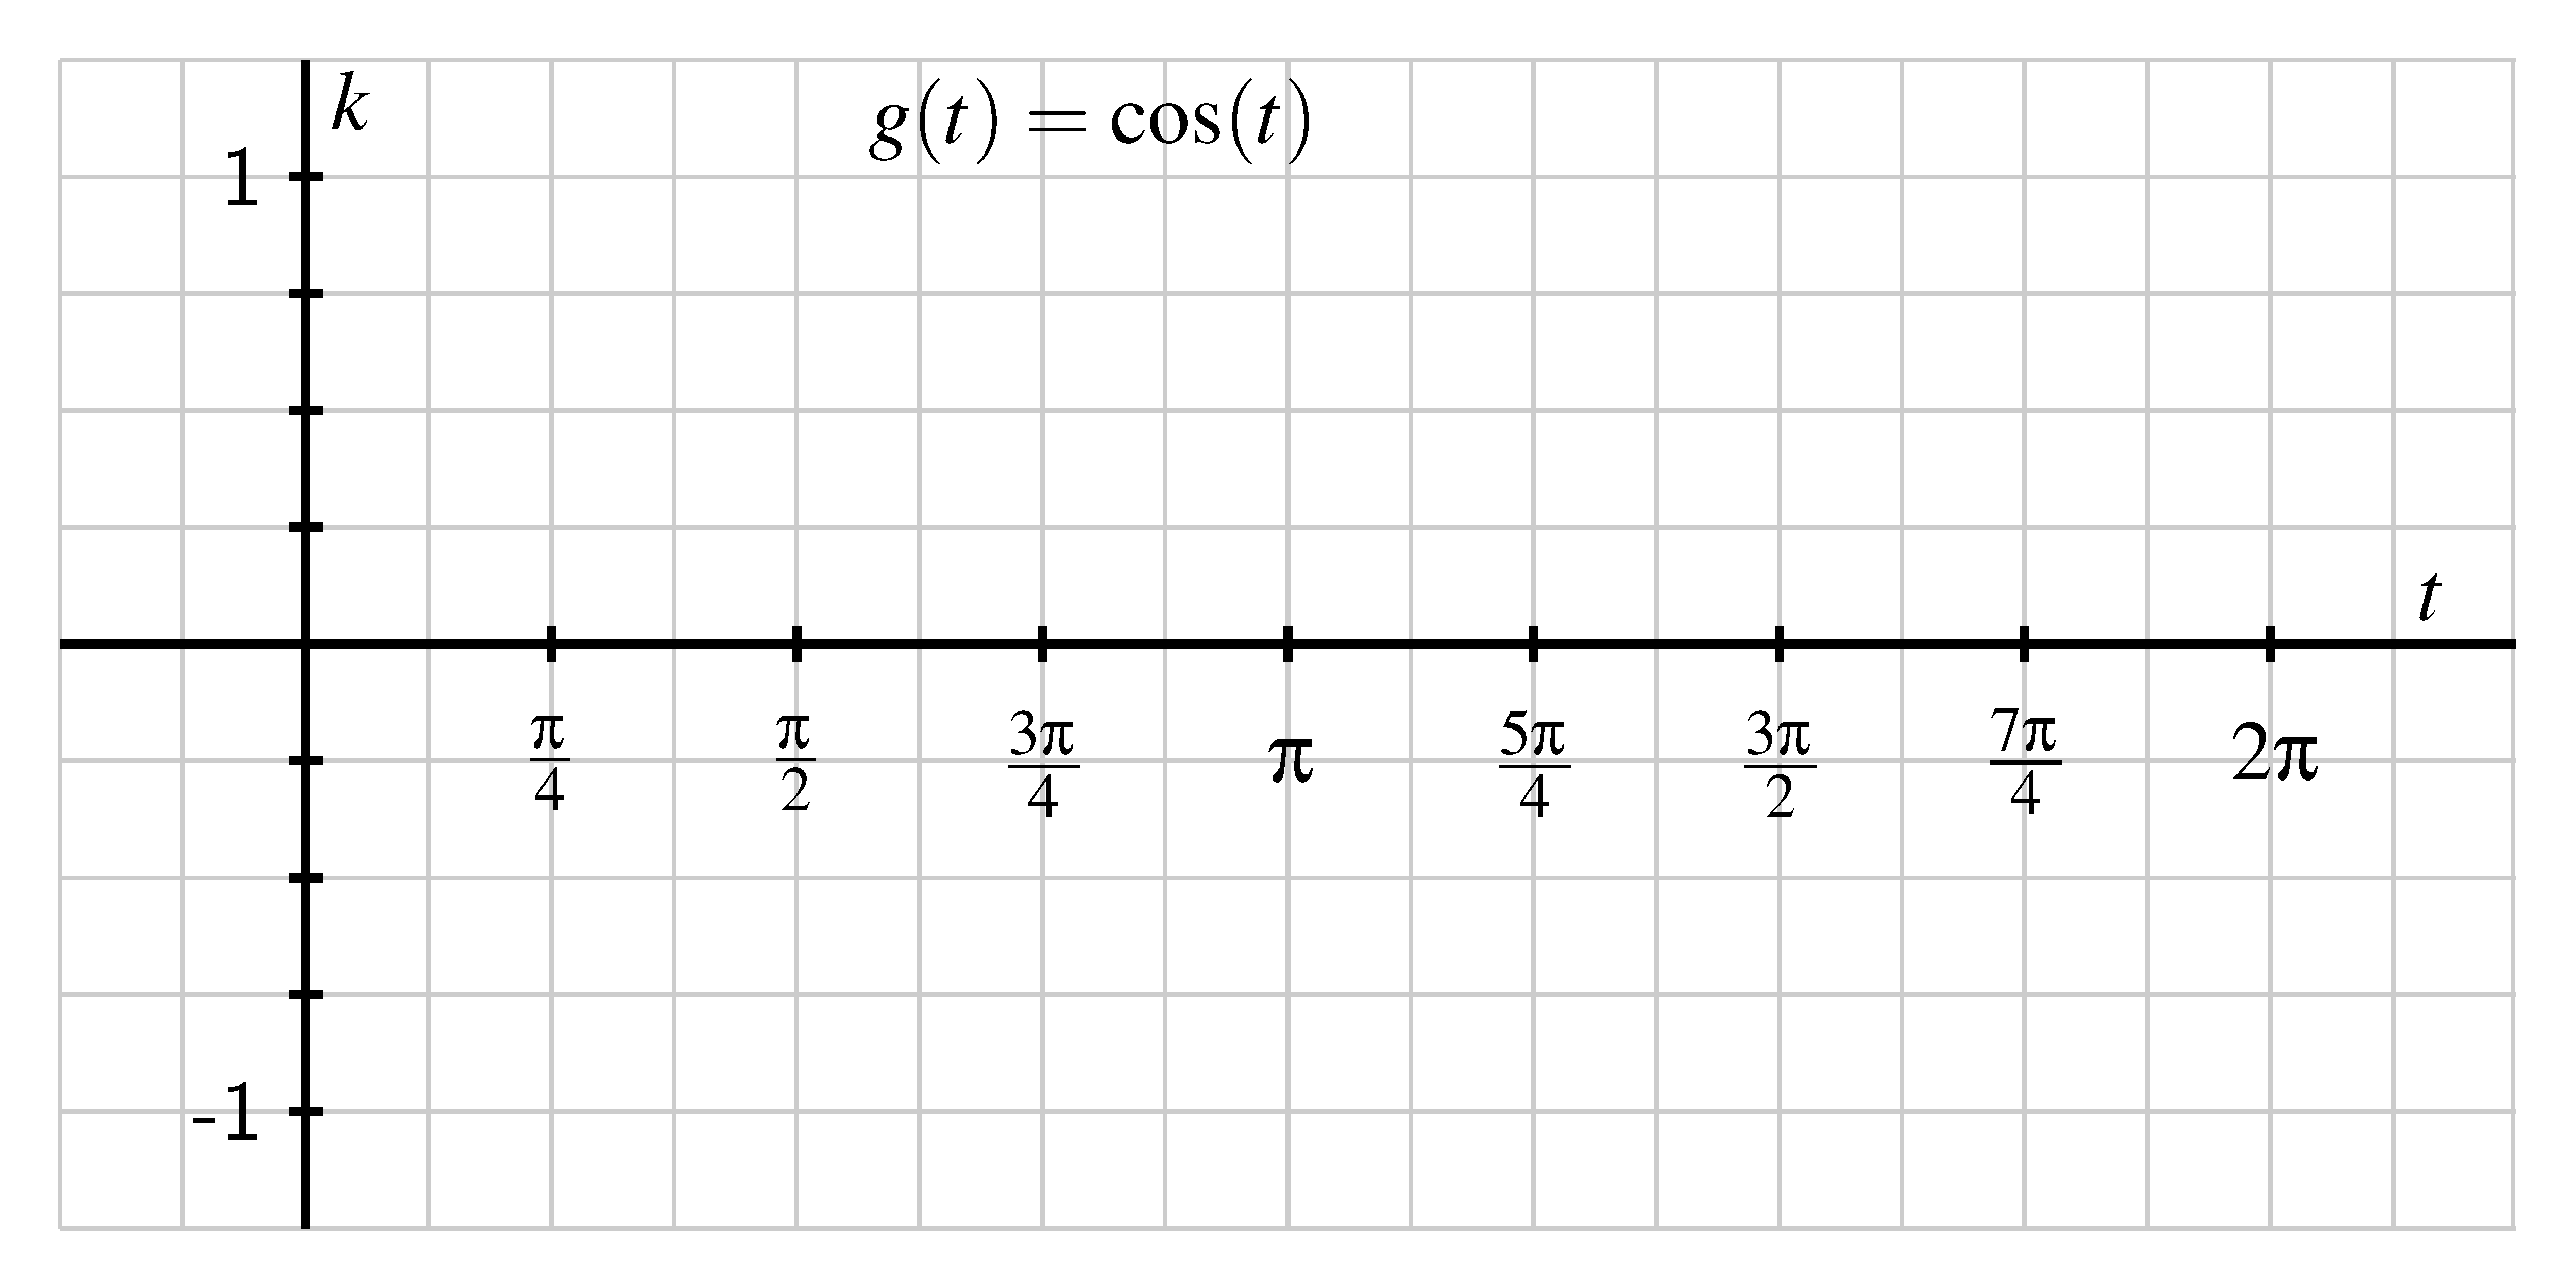
c.
On the axes provided, sketch an accurate graph of . Label the exact location of
several key points on the curve.
d.
What is the exact value of ? of ?
e.
Give four different values of for which .
f.
How is the graph of different from the graph of ? How are the graphs
similar?
As we work with the sine and cosine functions, it’s always helpful to remember their
definitions in terms of the unit circle and the motion of a point traversing the circle.
At https://www.desmos.com/calculator/9s1ms0nlyf you can explore and
investigate a helpful Desmos animation that shows how this motion around the circle
generates the cosine graph.
Properties of Sine and Cosine
Because the sine function results from tracking the -coordinate of a point traversing
the unit circle and the cosine function from the -coordinate, the two functions have
several shared properties of circular functions.
For both and ,
the domain of the function is all real numbers;
the range of the function is ;
the midline of the function is ;
the amplitude of the function is ;
the period of the function is .
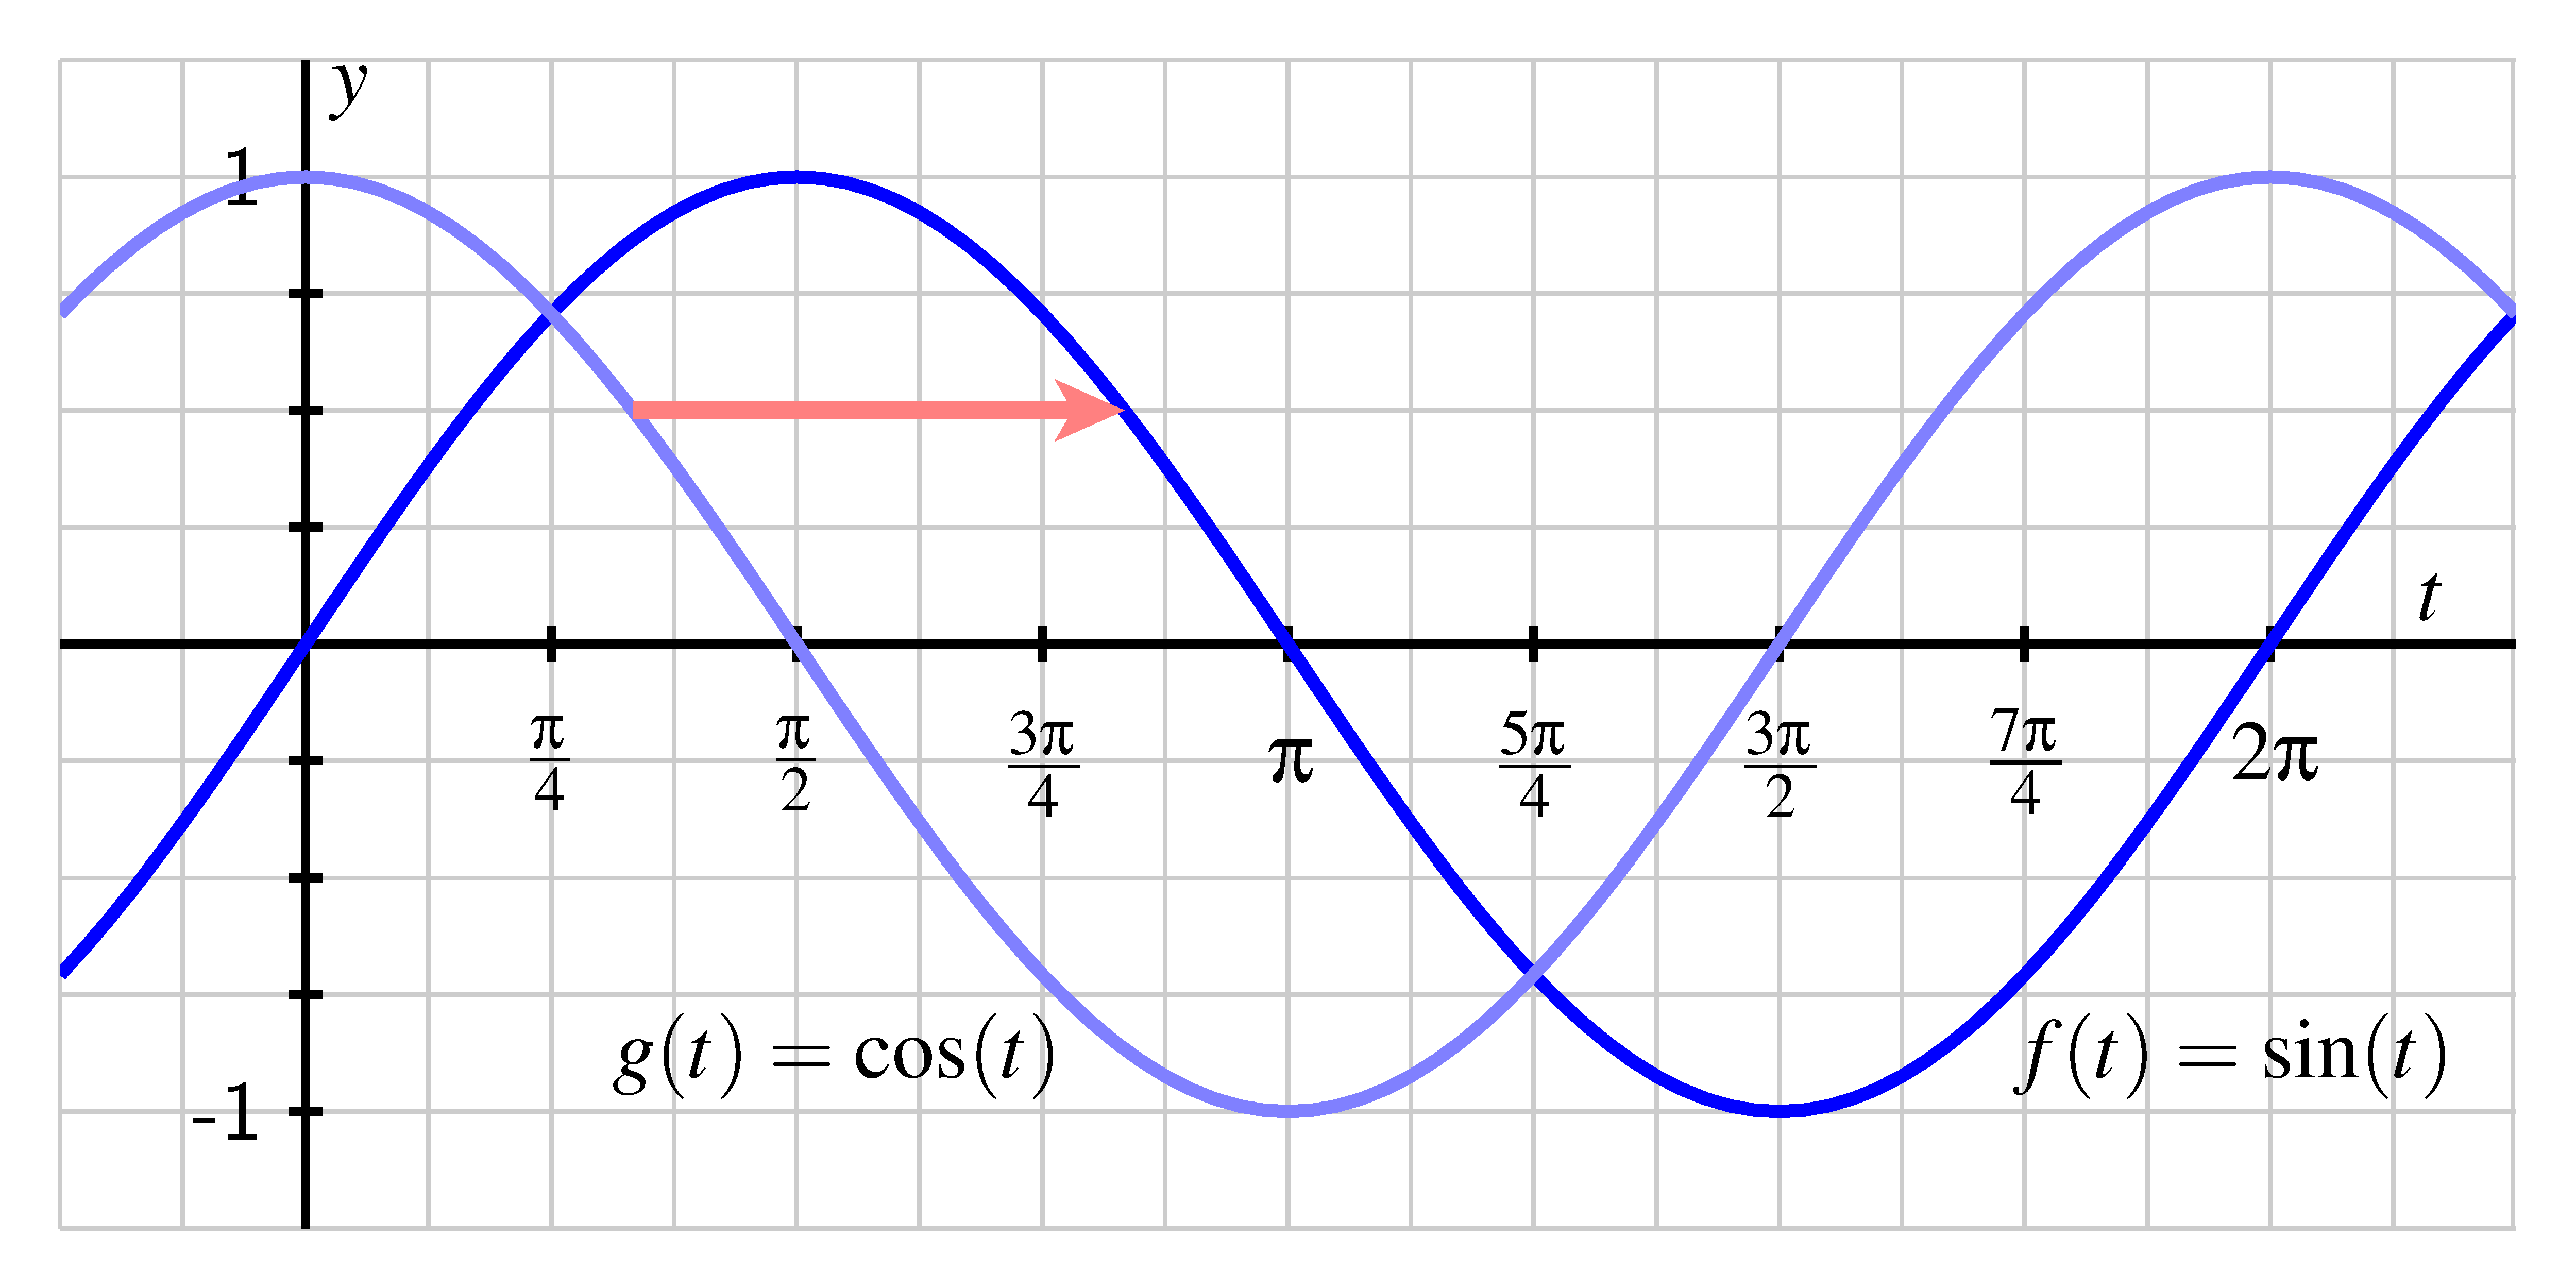
It is also insightful to juxtapose the sine and cosine functions’ graphs on the same
coordinate axes. When we do, as seen in the figure below, we see that the curves can
be viewed as horizontal translations of one another.
In particular, since the sine graph can be viewed as the cosine graph shifted units to the right,
it follows that for any value of ,
Similarly, since the cosine graph can be viewed as the sine graph shifted
left,
Because each of the two preceding equations hold for every value of , they are often
referred to as identities.
In light of the definitions of the sine and cosine functions, we can now view any point
on the unit circle as being of the form , where is the measure of the angle whose
vertices are , , and . Note particularly that since , it is also true that . We call this
fact the Fundamental Trigonometric Identity.
For any real number ,
There are additional trends and patterns in the two functions’ graphs that we explore
further in the following activity.
Use the figure below to assist in answering the following questions.
a.
Give an example of the largest interval you can find on which is decreasing.
b.
Give an example of the largest interval you can find on which is decreasing
and concave down.
c.
Give an example of the largest interval you can find on which is increasing.
d.
Give an example of the largest interval you can find on which is increasing
and concave up.
e.
Without doing any computation, on which interval is the average rate of
change of greater: or ? Why?
f.
In general, how would you characterize the locations on the sine and cosine
graphs where the functions are increasing or decreasingly most rapidly?
g.
For which quadrants of the - plane is negative for an angle in that
quadrant?
Using Computing Technology
We have established that we know the exact value of and for any of the -values
labeled on the unit circle, as well as for any such , where is a whole number, due to
the periodicity of the functions. But what if we want to know or or values for other
inputs not in the table?
Any standard computing device a scientific calculator, Desmos, Geogebra,
WolframAlpha, etc. has the ability to evaluate the sine and cosine functions at any
input we desire. Because the input is viewed as an angle, each computing device has
the option to consider the angle in radians or degrees. It is always essential that you
are sure which type of input your device is expecting. Our computational device of
choice is Desmos. In Desmos, you can change the input type between radians and
degrees by clicking the wrench icon in the upper right and choosing the desired units.
Radians is the default, and radians is what we will primarily use in both this class
and calculus.
It take substantial and sophisticated mathematics to enable a computational
device to evaluate the sine and cosine functions at any value we want; the
algorithms involve an idea from calculus known as an infinite series. While
your computational device is powerful, it’s both helpful and important to
understand the meaning of these values on the unit circle and to remember the
special points for which we know the outputs of the sine and cosine functions
exactly.
Answer the following questions exactly wherever possible. If you estimate a value, do
so to at least decimal places of accuracy.
a.
The coordinate of the point on the unit circle that lies in the third
quadrant and whose -coordinate is .
b.
The -coordinate of the point on the unit circle generated by a central angle
in standard position that measures radians.
c.
The -coordinate of the point on the unit circle generated by a central angle
in standard position that measures radians.
d.
The value of where is an angle in Quadrant II that satisfies .
e.
The value of where is an angle in Quadrant III for which .
f.
The average rate of change of on the intervals and .
g.
The average rate of change of on the intervals and .
The sine and cosine functions result from tracking the - and -coordinates
of a point traversing the unit circle counterclockwise from . The value of
is the -coordinate of a point that has traversed units along the circle from
(or equivalently that corresponds to an angle of radians), while the value
of is the -coordinate of the same point.
The sine and cosine functions are both periodic functions that share the
same domain (the set of all real numbers), range (the interval ), midline
(), amplitude (), and period (). In addition, the sine function is horizontal
shift of the cosine function by units to the right, so for any value of .
If corresponds to one of the special angles that we know on the unit circle,
we can compute the values of and exactly. For other values of , we can
use a computational device to estimate the value of either function at a
given input; when we do so, we must take care to know whether we are
computing in terms of radians or degrees.