- Dylan
- Hey Julia, can you help me with this problem?
- Julia
- Yeah, of course! What do you need?
- Dylan
- I’m supposed to approximate area under a curve, and I don’t really see what to do.
- Julia
- Actually, that’s pretty easy! We’ll just use Riemann sums.
Introduction
Riemann sums are a method of approximating area under a curve. In this lab, we will look at three varieties; left, right, and midpoint.
Please answer to at least three decimal places throughout this lab!
Obtained from mathforum.org
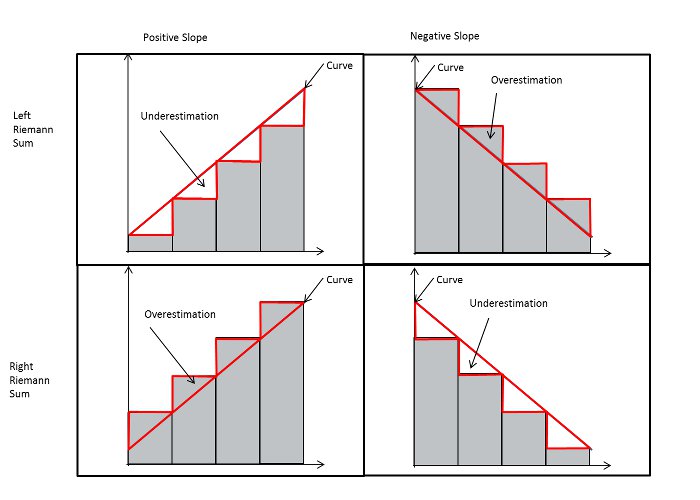
To create Riemann sums, you simply pick a number of desired subintervals, and then evenly divide the interval to produce the desired number. From here, we choose the height of what will be our rectangles differently for each version:
- Left Riemann Sum: The height is calculated using the left endpoint of the subinterval.
- Right Riemann Sum: The height is calculated using the right endpoint of the subinterval.
- Midpoint Riemann Sum: The height is calculated using the midpoint of the subinterval.
From here, we simply add the area of each rectangle to produce the area under the curve.
If we are approximating area with rectangles, then
Increasing, Concave Up
Consider the function on the interval [1, 6].
The left Riemann sum.
What did you get for the left Reimann sum from evaluating the above Sage cell?The right Riemann sum.
What did you get for the right Reimann sum from evaluating the above Sage cell?The midpoint Riemann sum.
What did you get for the midpoint Reimann sum from evaluating the above Sage cell?Compute the integral numerically by evaluating the following Sage cell. Which of these estimates was most accurate? Show the percent error for each type of Riemann sum, rounding to two decimal places.
Most Accurate:
Middle Percent Error: %
Right Percent Error: %
Decreasing, Concave Up
Calculate the following Riemann sums by modifying the code provided in the first question to have seven subintervals and reflect the new endpoints.
The left Riemann sum.
The right Riemann sum.
The midpoint Riemann sum.
Compute the integral numerically. Which of these estimates was most accurate? Show the percent error for each type of Riemann sum, rounding to two decimal places.
Most Accurate:
Middle Percent Error: %
Right Percent Error: %
Increasing, Concave Down
Calculate the following Riemann sums by modifying the code provided in the first question to have four subintervals and reflect the new endpoints and new function.
The left Riemann sum.
The right Riemann sum.
The midpoint Riemann sum.
Compute the integral numerically. Which of these estimates was most accurate? Show the percent error for each type of Riemann sum, rounding to two decimal places.
Most Accurate:
Left Percent Error: %
Middle Percent Error: %
Right Percent Error: %
Decreasing, Concave Down
Calculate the following Riemann sums by modifying the code provided in the first question to have four subintervals and reflect the new endpoints and new function.
The left Riemann sum.
The right Riemann sum.
The midpoint Riemann sum.
Compute the integral numerically. Which of these estimates was most accurate? Show the percent error for each type of Riemann sum, rounding to two decimal places.
Most Accurate:
Middle Percent Error: %
Right Percent Error: %
- Dylan
- That’s cool! Thanks Julia!
- Julia
- No problem!
- Dylan
- I wish I could make the sums more accurate though... some of them are pretty far off.
- James
- I think if you put your mind to it you could Dylan!
- Julia and Dylan
- James! You’re late to class!
- James
- Haha no problem, I love helpi... that’s not the point! Listen, just use sum notation, and try to make infinitely many subintervals. If you can do that, you’ll have an accurate area.
How would you represent the width of each rectangle when divided into subintervals?
How would you represent the height of each rectangle when divided into subintervals?
How could you use sigma notation to represent the area under the curve from to , as approaches infinity?
- Julia
- Wow, that’s just as accurate as asking our computers!
- James
- That’s right Julia! You just found the integral of a function, with just a little guidance!
- Julia and Dylan
- Wow! Thanks James!
In Summary
We’ve learned a lot about Riemann sums today, and even the formula for a definite integral! So let’s recap:
- (a)
- Left endpoint Riemann sums use the left endpoint of the subinterval to approximate the area.
- (b)
- Right endpoint Riemann sums use the right endpoint of the subinterval to approximate the area.
- (c)
- Midpoint Riemann sums use the midpoint of the subinterval to approximate the area.
Following this, the area of each rectangle is added to approximate the area under the curve.
- The formula for the definite integral is where and are the endpoints of the interval.