Introduction
- Dylan
- Using CAS systems to graph is great and all, but on a test where I don’t have a calculator it’s so hard to sketch a curve!
- James
- Well maybe we can use derivatives to figure out properties of the graph so it’s easier to sketch!
- Dylan
- Oh! We’d be able to see where the graph was heading up or down, plus we’d be able to see extrema when the derivative at a point is zero!
Guided Problems
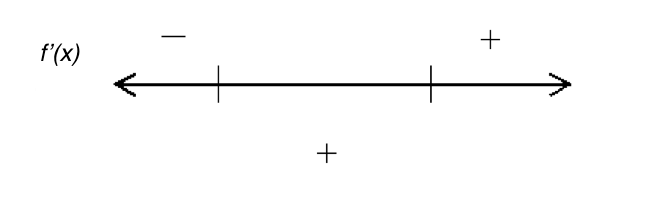
On what interval(s) is the derivative positive?
On what interval(s) is the derivative negative?
Select everything you can always say about the graph of a function at a point where the derivative is 0:
- Julia
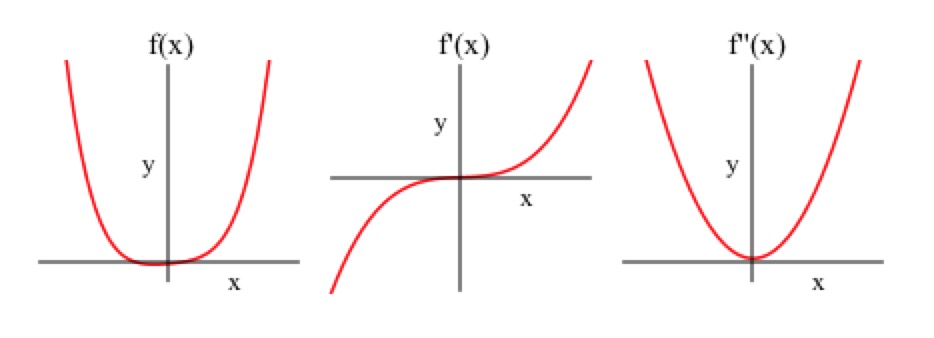
- So we have local maxima or minima when the derivative is 0, but what about the graph of ?
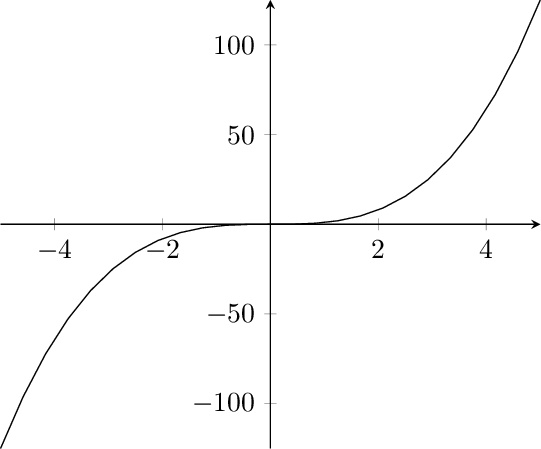
- Dylan
- Hmmm...I guess that means there are three different kinds of critical points! Two when the sign changes and one when it stays the same!
- Julia
- Wait... what’s a critical point?
- Dylan
- A critical point is any point where the derivative is zero or does not exist! Because we know it’s important, but we have to check to see what it means with our number line!
- James
- You guys are still figuring that out? I’m already determining concavity!
- Dylan and Julia
- Holy cat fur! What’s concavity?!
- James
- A graph is concave up when its derivative is increasing, and concave down when its derivative is decreasing. The easiest way to tell is to look at the curve and think ‘Would this hold water?’ If it would, it’s concave up, and if not, it’s concave down!
- Dylan and Julia
- Wow! Thanks James!
Now determine the second derivative, , of our original function . What happens at the points where the second derivative is zero?
Points where concavity changes are known as inflection points.
Draw another number line, this time for the second derivative, marking where the derivative equals zero. Evaluate on a point of each of the intervals created through this marking, and mark the sign. What might this mean in general for changing signs on each side of an inflection point?
second derivative around that point.
Inflection points are given as ordered pairs. Evaluate each inflection point you found using to determine the ordered pairs, then select them below.
Based on what you’ve done until now, sketch the graph yourself. When you’re done, click below to see the graph.- Julia
- Wait but what about the graph of ? at the origin but the graph doesn’t change concavity see?
- Dylan
- Oh jeez, does that mean that not every instance of is an inflection point?
- James
- Not always! That’s why you have to make another number line for the second derivative to see if the sign of changes on either side of the point where .
On Your Own
Select each type of extrema present on the graph.
Indicate the coordinates of any critical points.
Indicate the coordinates of any inflection points.
Select the intervals on which the function is concave up.
Select the intervals on which the function is concave down.
Now, create a sketch of your function on paper. When you’re done, click below to see how your graph should look!
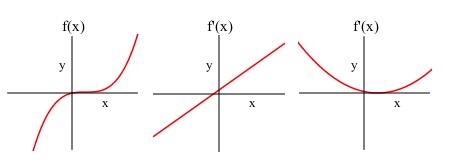
Matching Graphs
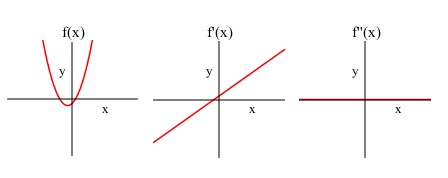
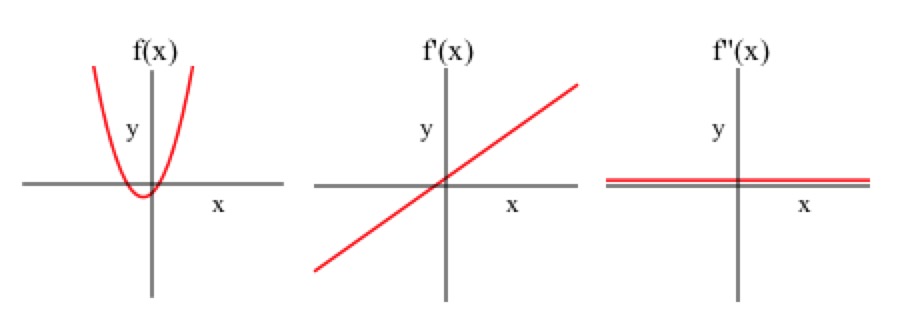
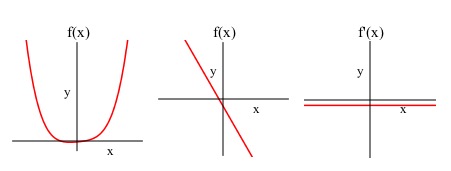
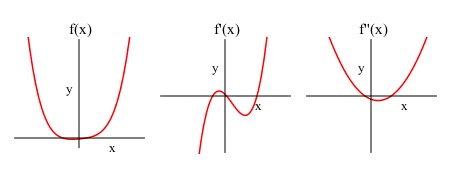
- Dylan
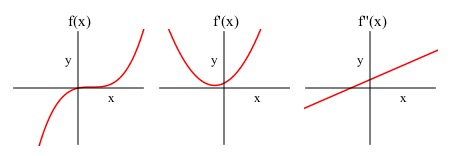
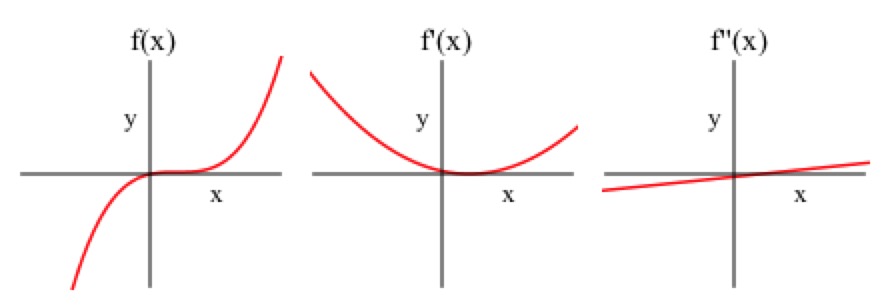
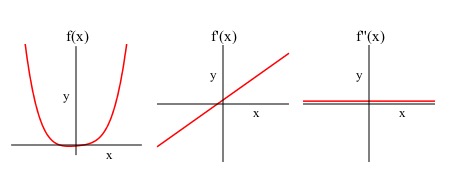
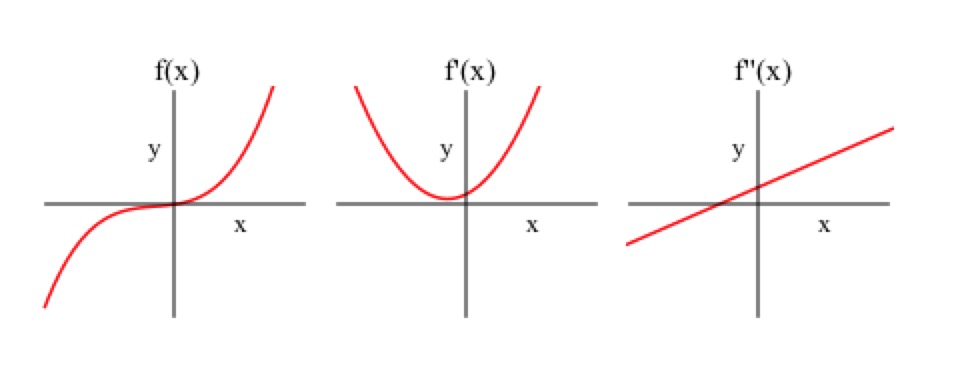
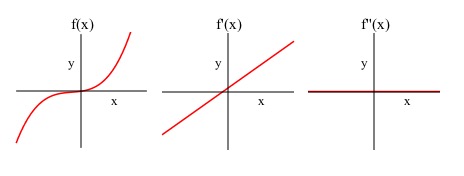
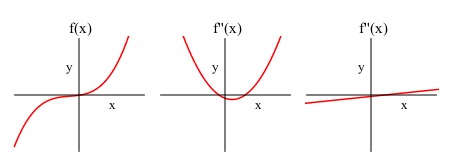
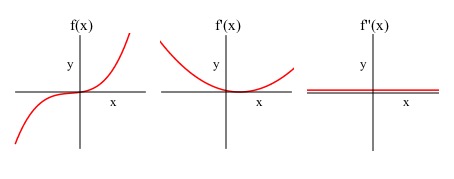
- So if I wanted to match a graph with the graphs of its first and second derivative I can do that now!
- Julia
- Wait, really?? How?
- James
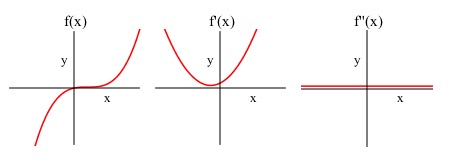
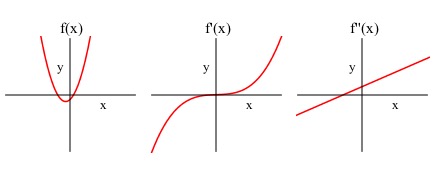
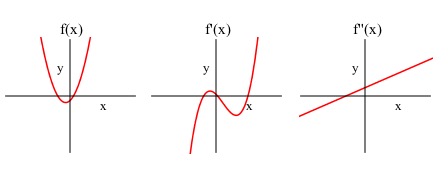
- Well the value of corresponds to the slope of , and the value of corresponds to the slope of and is related to the concavity of .
- Julia
- So we can match the graphs based on how all that information relates!
- Dylan
- Exactly, let’s try it!
In Summary
In this lab, you’ve covered quite a bit. To help organize everything, we’ve put the important theorems below.
We’ve also included the second derivative test, which is another method to determine if a critical point is a maximum, minimum, or saddle point. To do this, you simply evaluate the second derivative at the critical point, and determine what that point is based on the value, as shown in the table.
- (a)
- If changes from positive to negative at , then has a local maximum at .
- (b)
- If changes from negative to positive at , then has a local minimum at .
- (c)
- If does not change sign at , then has a saddle point at .
- (a)
- If for all , then is concave up on
- (b)
- If for all , then is concave down on