The magnitude of force that a particle of charge exerts on a particle of charge that is units away is given by Coulomb’s Law
where is Coulomb’s constant.
When several charges are placed near each other, the force that a test particle of charge experiences is determined by adding the forces that each charged particle exerts on it. The electric field is a “vector field”; to each point in the -plane, the electric field associates the force vector experienced by the test charge .
An interesting fact is that this electric field can actually be realized as the gradient of a certain function , called the electric potential via the formula
and a useful way to visualize electric fields to plot the level curves of the electric potential. These level curves are often referred to as equipotential lines.
The contour plot for the electric potential are below shows equipotential lines for an electric field that results from a charge configuration with positive charges at and and a negative charge at .
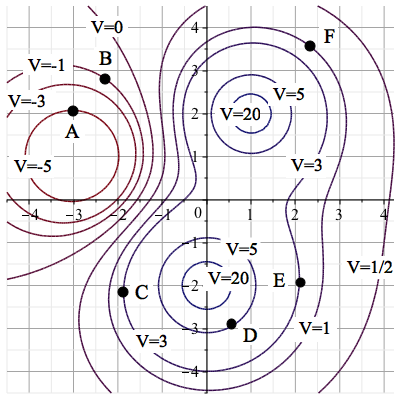
Select all of the points where .
An important observation is the following.
Since the values of a function do not change along a level curve, the tangent line to a level curve gives the direction in which the instantaneous rate of change of the function is .
is the instantaneous rate of change of the function at in the -direction. Thus, to find the points at which , we need to look for the locations where the tangent line to the level curve is in the -direction. This occurs at point only.
- We’ve already determined that at point .
- As increases from point , we move from the contour curve along which towards the one where . Thus, at .
- As increases from point , we move from the contour curve along which towards the one where . Thus, at .
- As increases from point , we move from the contour curve along which towards the one where . Thus, at .