You are about to erase your work on this activity. Are you sure you want to do this?
Updated Version Available
There is an updated version of this activity. If you update to the most recent version of this activity, then your current progress on this activity will be erased. Regardless, your record of completion will remain. How would you like to proceed?
Mathematical Expression Editor
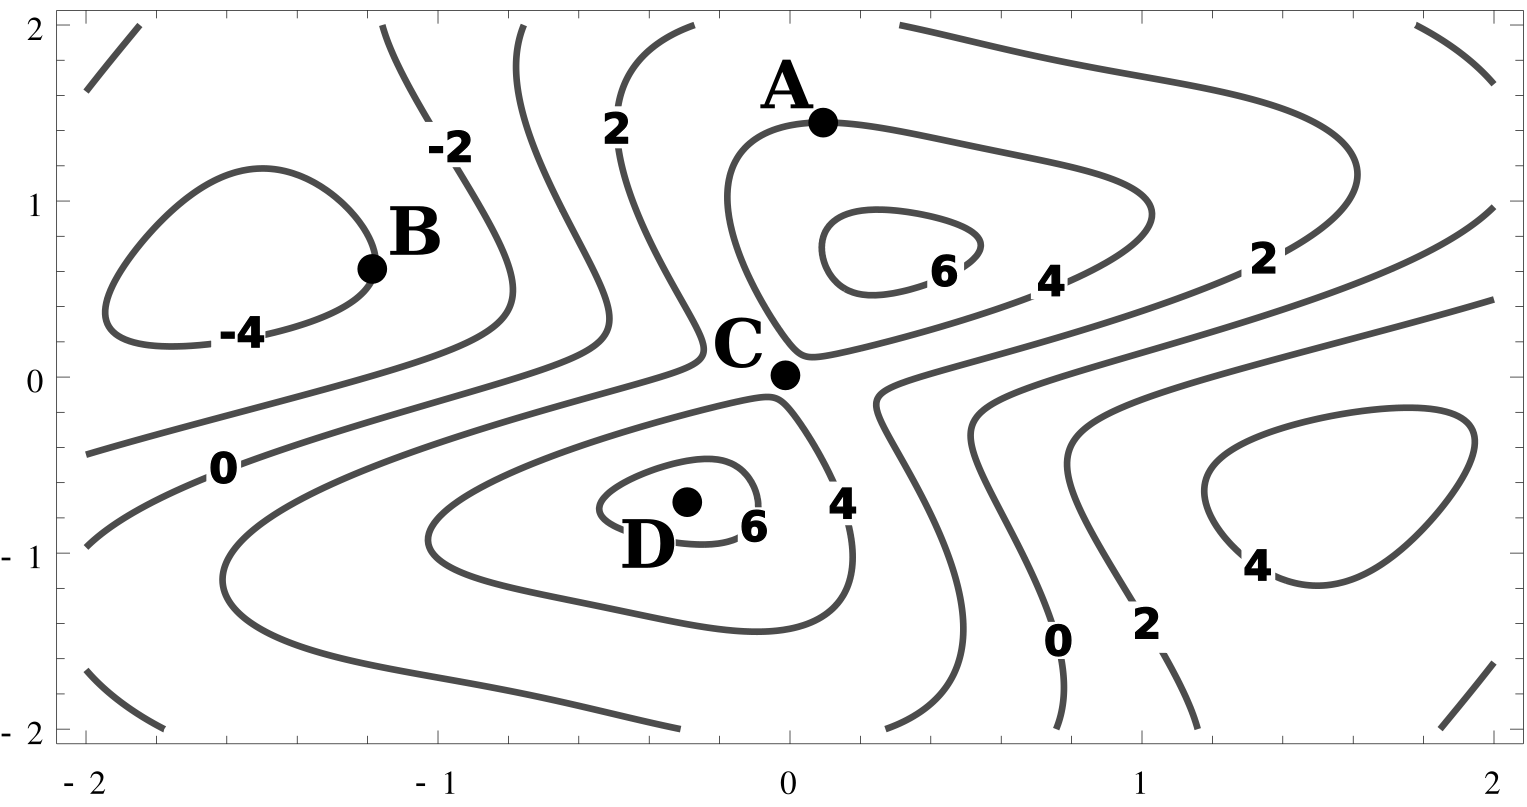
Consider the following contour plot for :
Assume either increases or decreases between contour lines and at any of the points
in the contour plot below.
List all labeled points where and .