Instructions for making graphics and videos.
Images
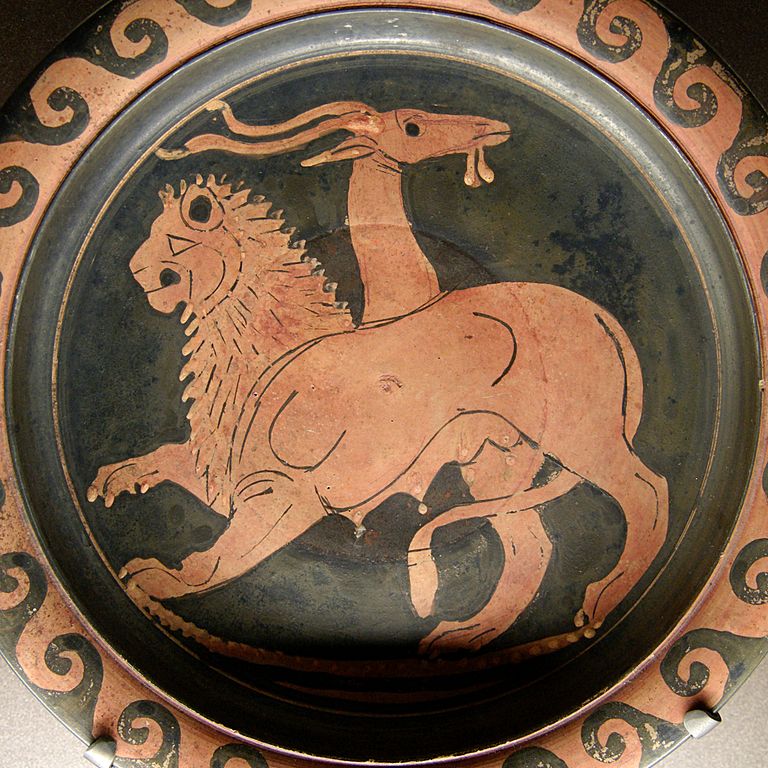
One way to insert images into a Ximera activity, is to have the image in the directory with \includegraphics. We recommend using the image environment for all of you images.
\begin{image}

\includegraphics{chimera.jpg}

\end{image}

\graphicspath{

{./}

{graphicsAndVideos/}

}
Another way to include graphics is to use Tikz. In some sense this is preferred, as then the source produces the images.
\begin{image}

  \begin{tikzpicture}

    \begin{axis}[

        xmin=-6.4,


        xmax=6.4,

        ymin=-1.2,

        ymax=1.2,

        axis lines=center,

        xlabel=$x$,

        ylabel=$y$,

        every axis y label/.style={at=(current axis.above origin),anchor=south},

        every axis x label/.style={at=(current axis.right of origin),anchor=west},

      ]

      \addplot [ultra thick, blue, smooth] {sin(deg(x))};

    \end{axis}

  \end{tikzpicture}

\end{image}
Interactive graphics
The graph command
The easiest way to include an interactive graph is to use the \graph command. Unfortunately, the \graph command doesn’t draw a graph in the PDF, rather, it states (in words) that a graph is produced. There are a number of options for the \graph command:
Change viewing window
\[Restricting domain
\graph[xmin=-5,xmax=5,ymin=-5,ymax=5]{y=x^2}
\]
\[Default panel displayed
\graph{x^2 \left\{ 1 \leq x \leq 10 \right\} }
\]
\[

\graph[panel]{x^2}

\]
Restricting window
\[Axis labels
\graph[xmin=0, xmax=10, ymin=0, ymax=10]{x^2}
\]
\[Hide axes
\graph[xAxisLabel="time", yAxisLabel="distance"]{y=x}
\]
\[Hide tick marks
\graph[hideXAxis=true, hideYAxis=true]{x^2}
\]
\[Polar graphing
\graph[hideXAxisNumbers=true, hideYAxisNumbers=true]{x=y^2}
\]
\[

\graph{r=\theta}

\]
Polar gridlines
\[Graphing a piecewise function
\graph[polar]{y=x^2}
\]
\[

\graph{ \sin(x)\left\{x<0\right\}, 2x\left\{ x>=0 \right\} }

\]
Desmos
If you require further features from Desmos, you can sign up for an account and include your worksheets like this:
\begin{center}

\desmos{zwywds7med}{800}{600}

\end{center}
GeoGebra
You can also use GeoGebra. Embed the widget using the syntax \geogebra{ID}{width}{height}, where ID is the widget ID and width and height are the dimensions (in pixels) you want the embedded widget to have.
\begin{center}

\geogebra{XC3FXUdJ}{800}{600}

\end{center}
Note, you may wish to use the onlineOnly environment with your interactives.
Videos
You can also embed YouTube videos.
\begin{center}

\youtube{0aQpLSu2fMs}

\end{center}