You are about to erase your work on this activity. Are you sure you want to do this?
Updated Version Available
There is an updated version of this activity. If you update to the most recent version of this activity, then your current progress on this activity will be erased. Regardless, your record of completion will remain. How would you like to proceed?
Mathematical Expression Editor
Please answer each of these questions to the best of your ability. You are welcome to
re-watch parts of any of the videos to help you.
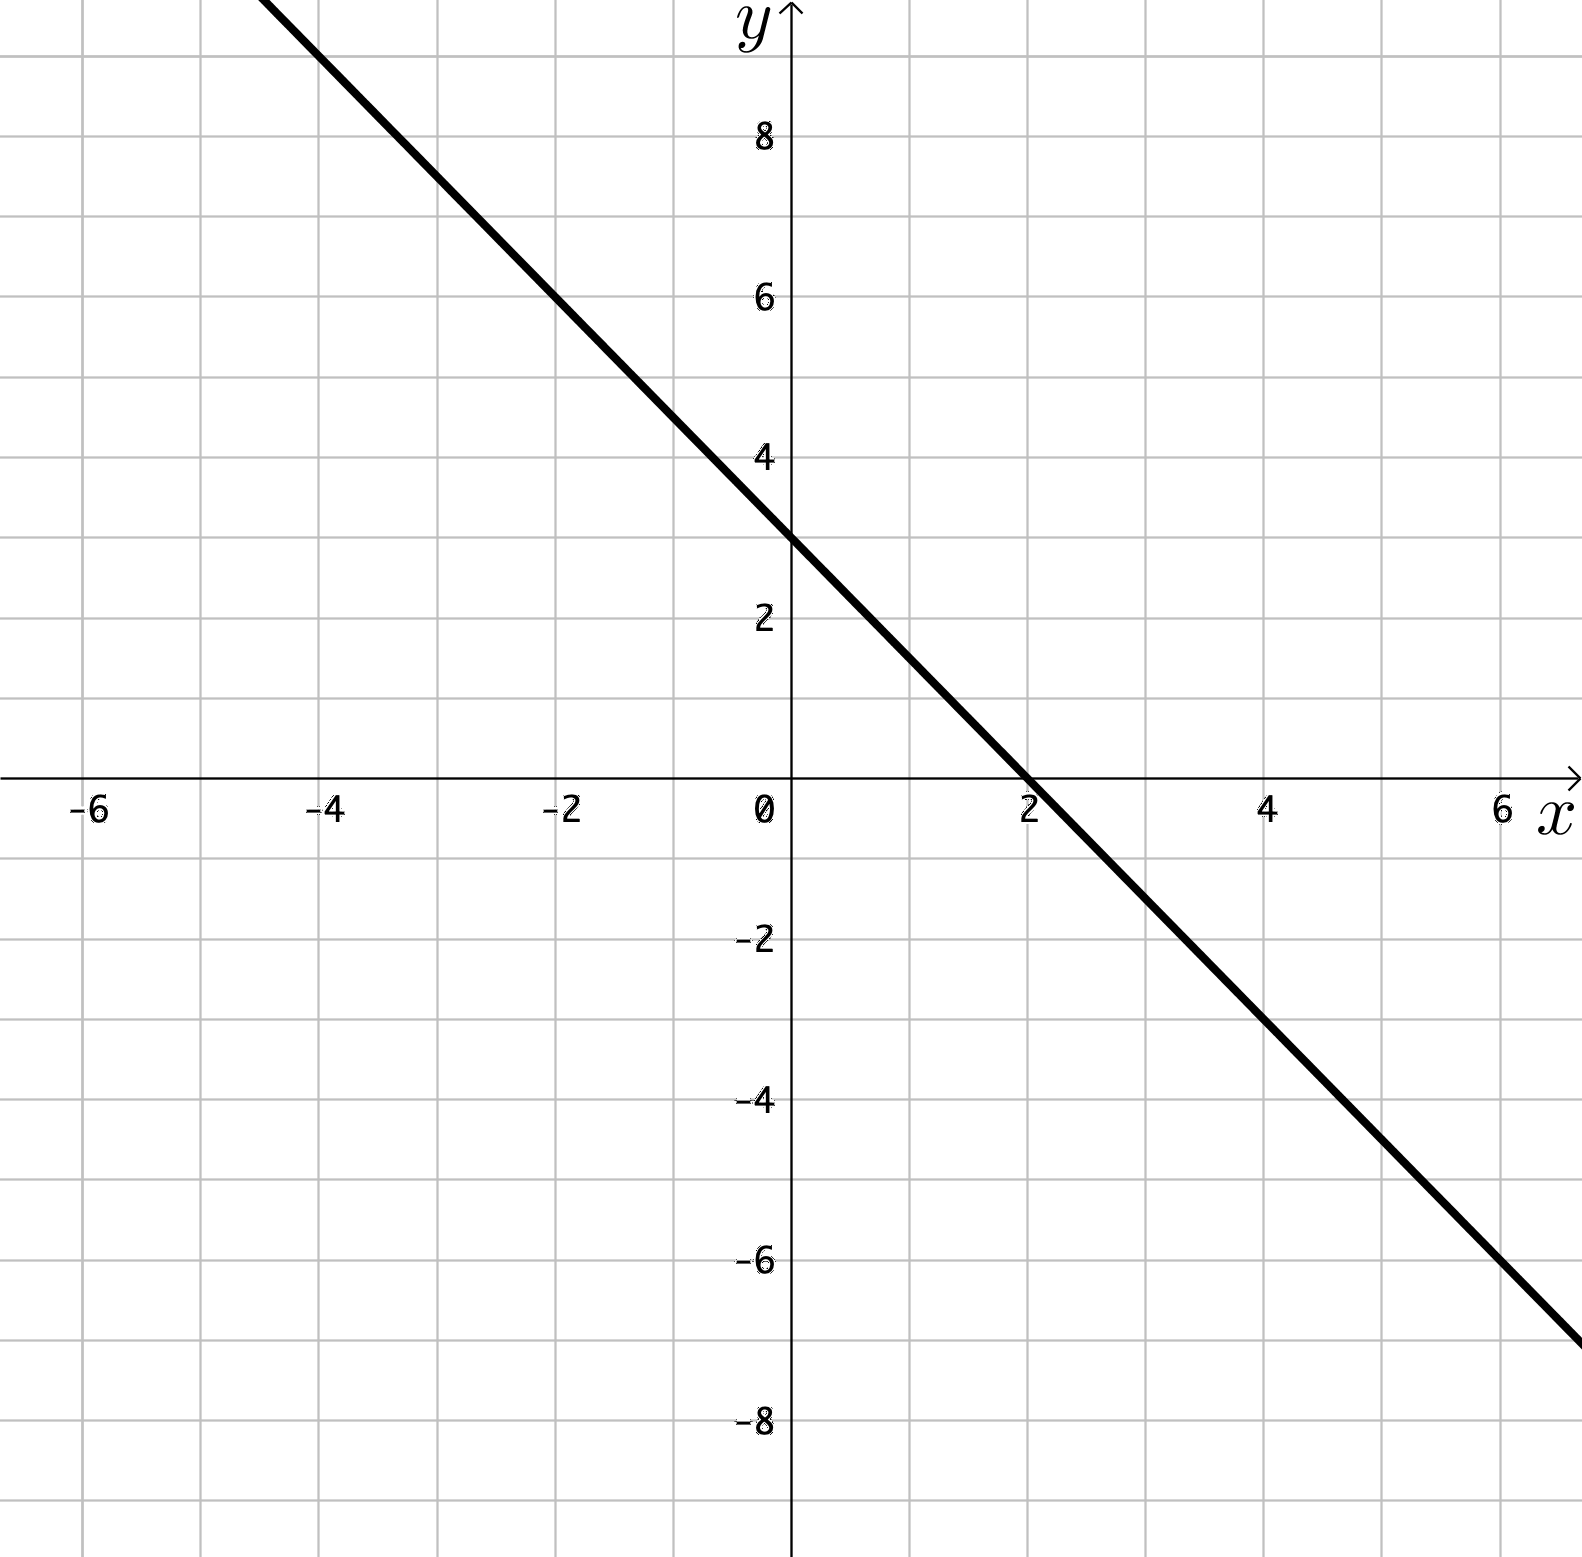
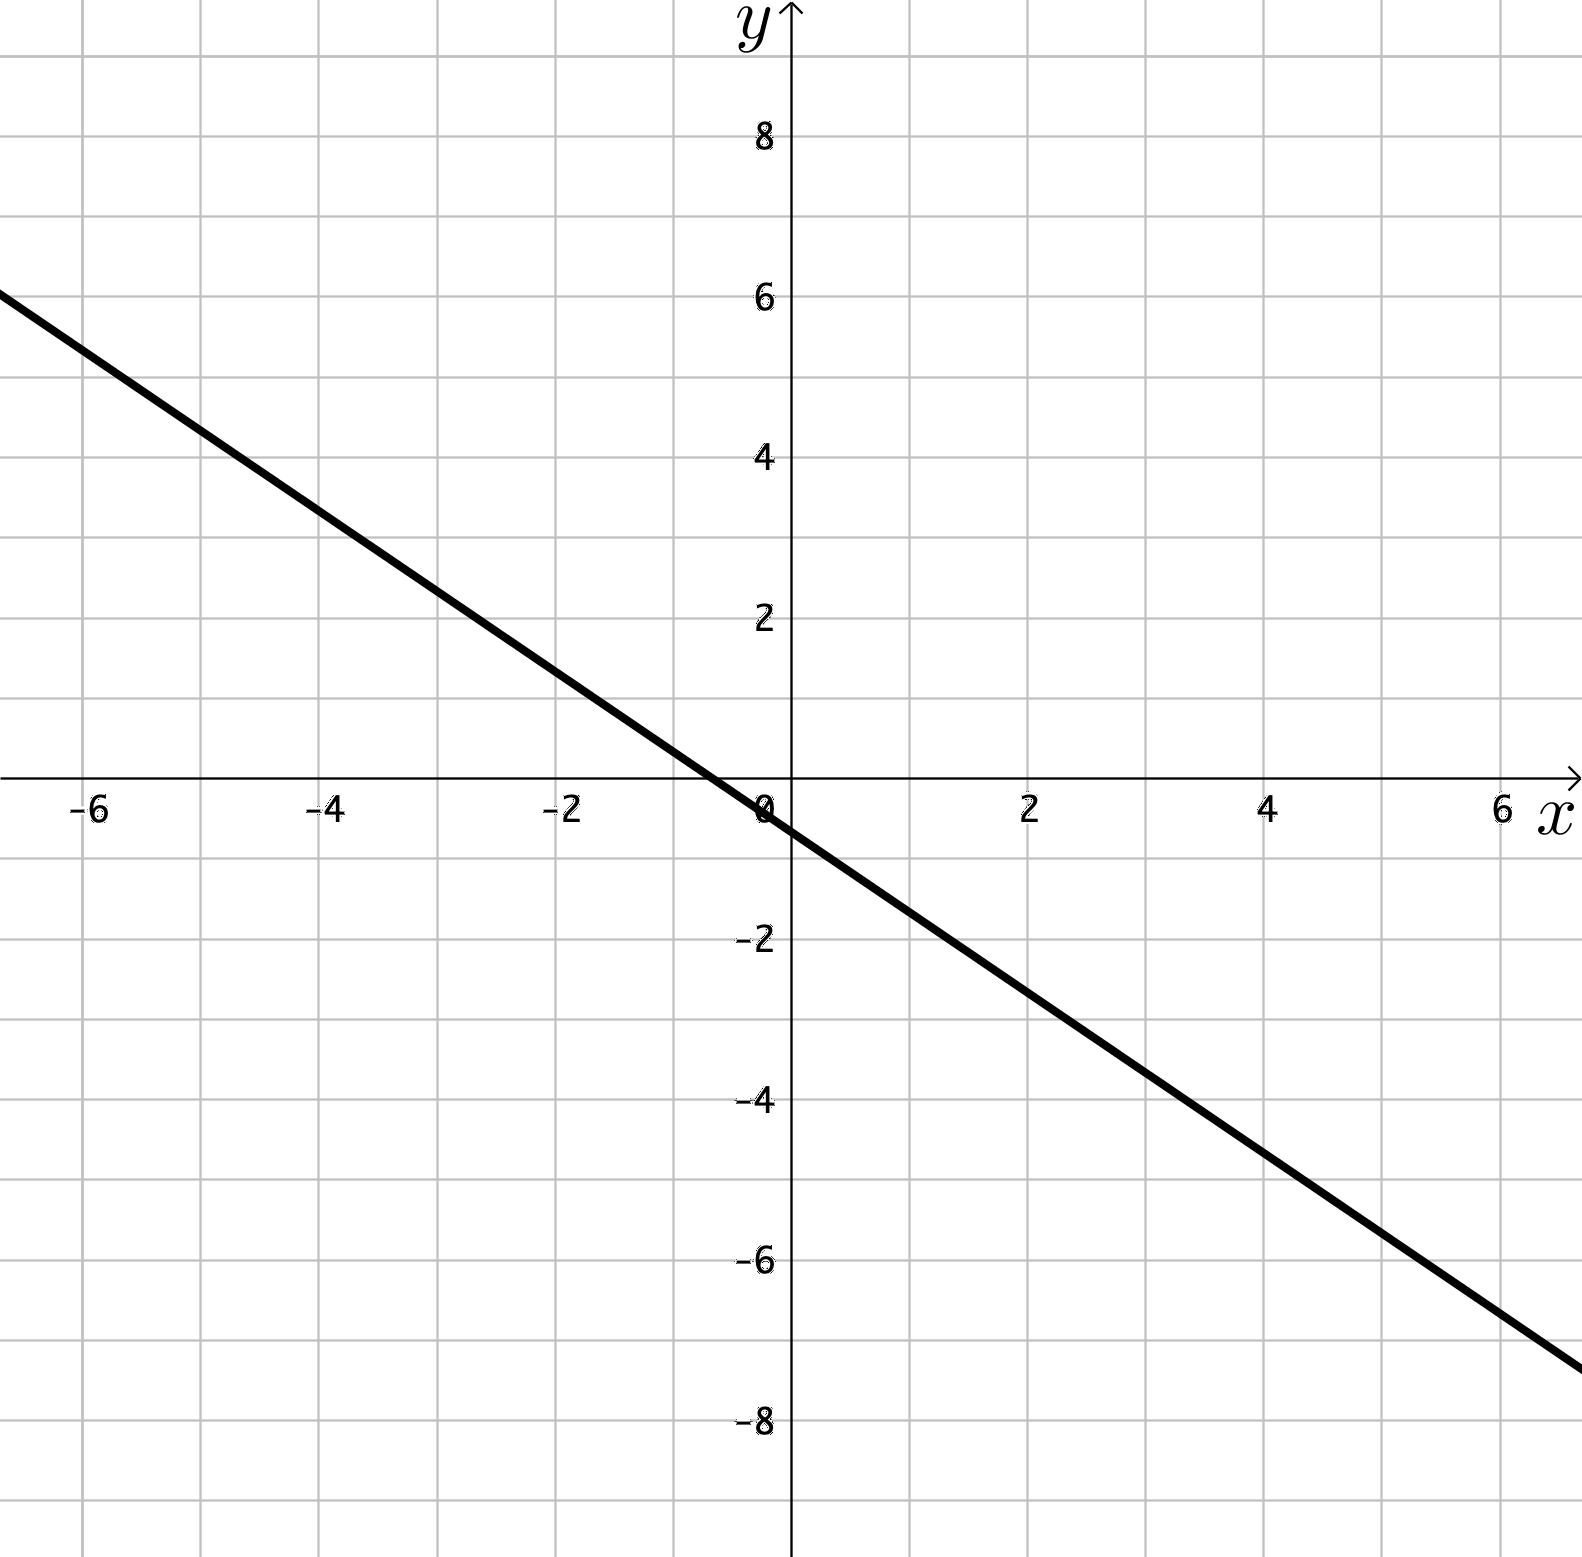
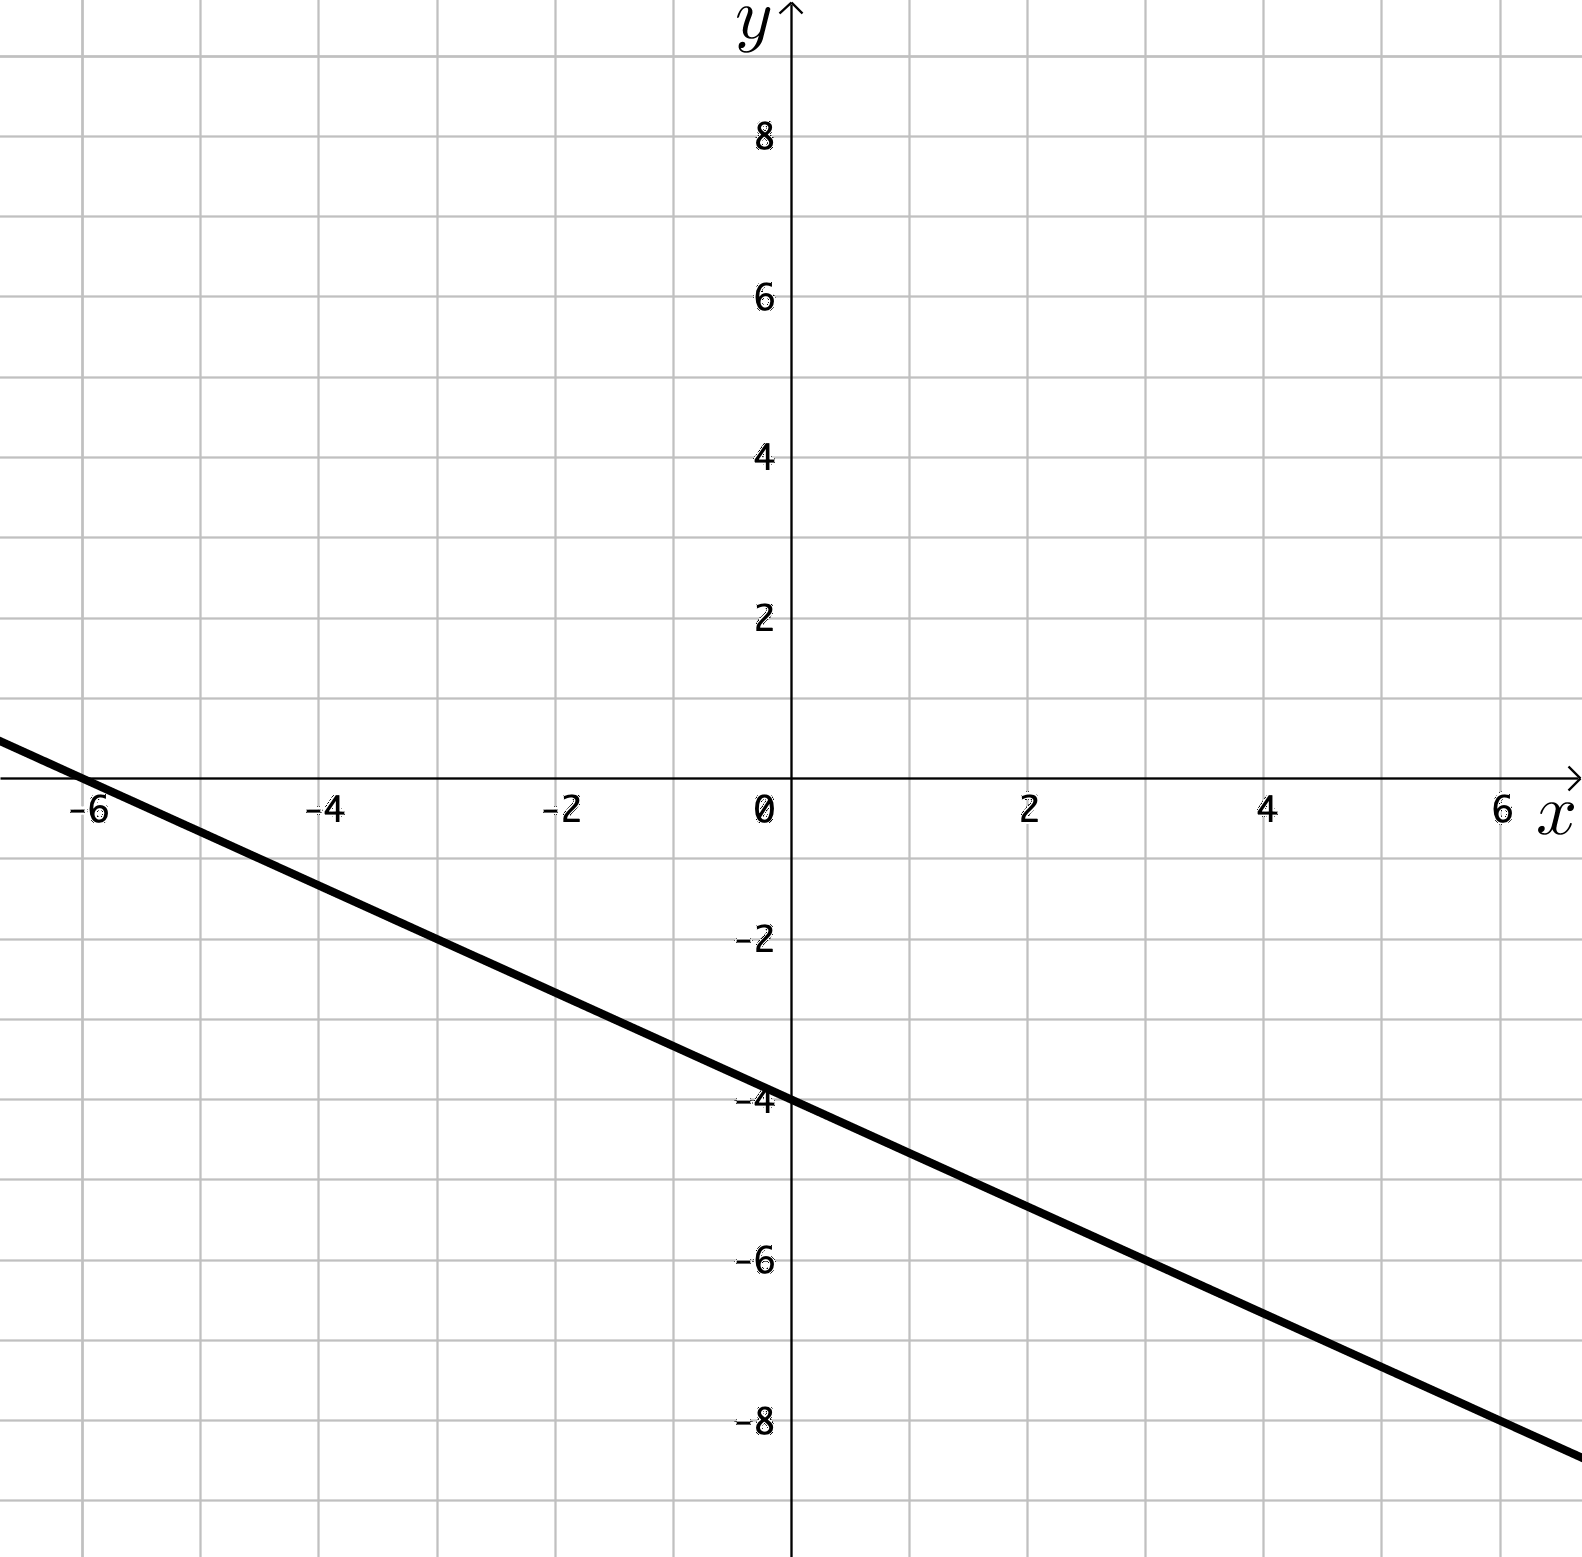
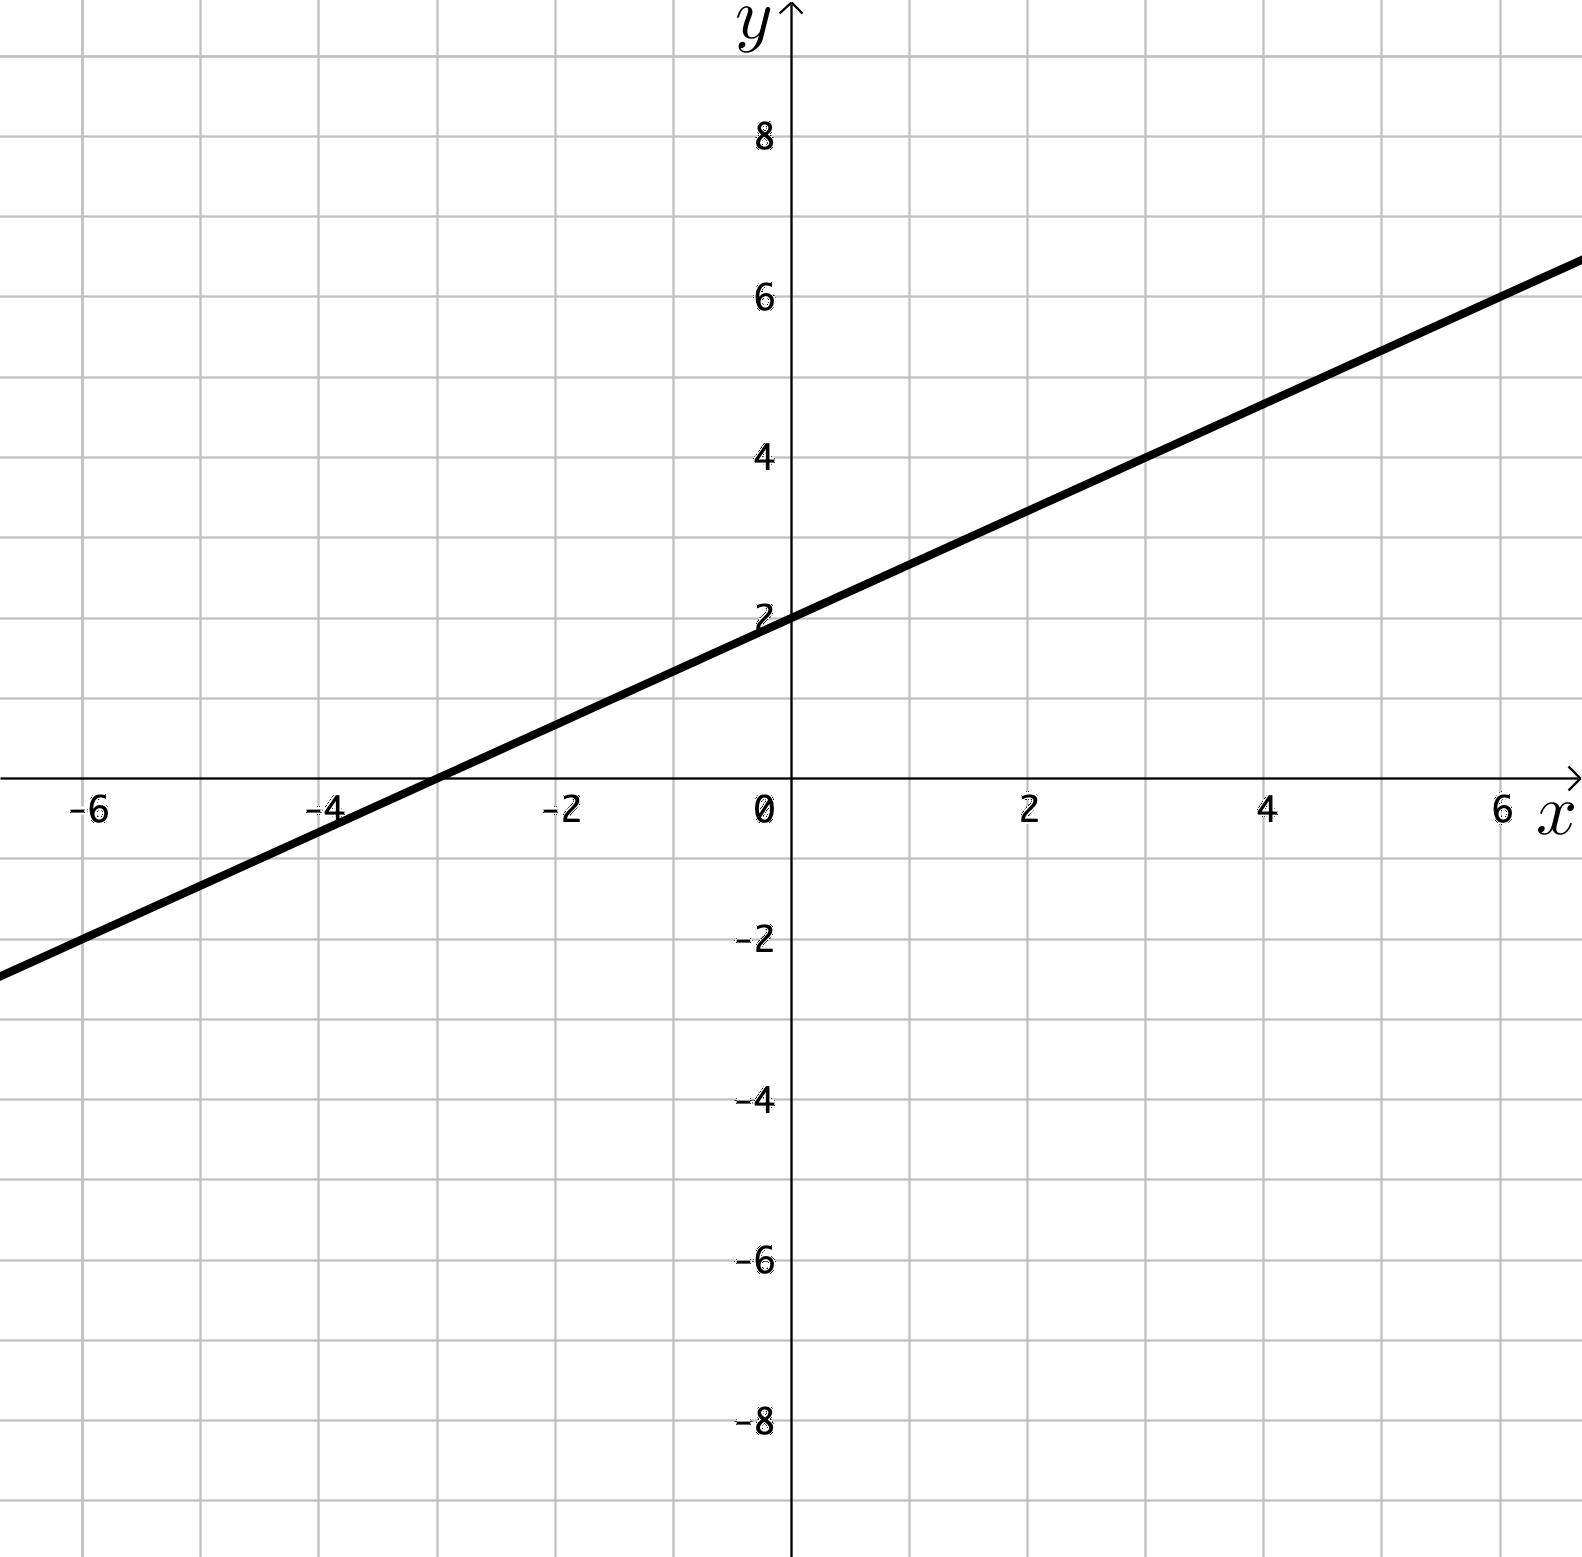
Suppose is a linear function of . Let represent the change in the value of and let
represent the change in the value of . Which of the following graphs could represent
the relationship between and provided .
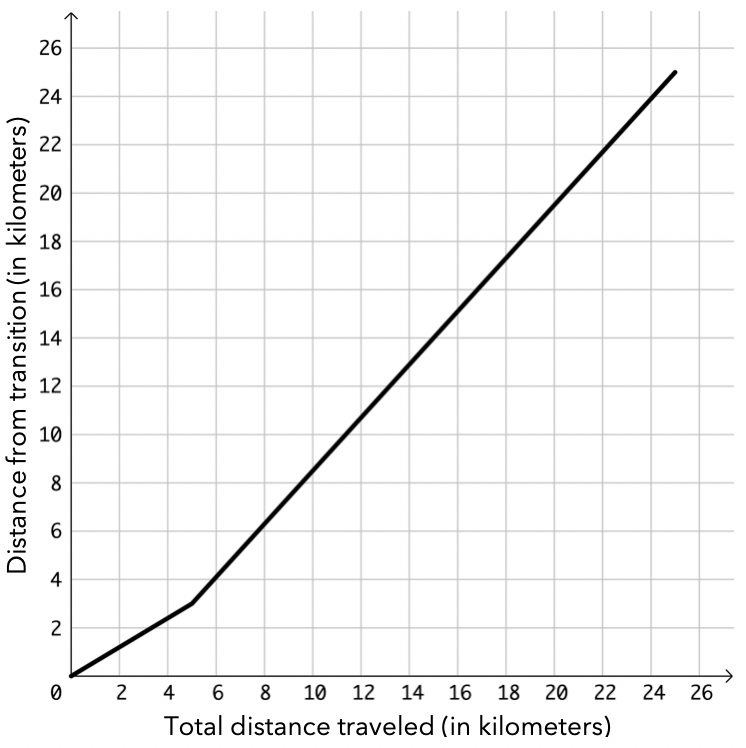
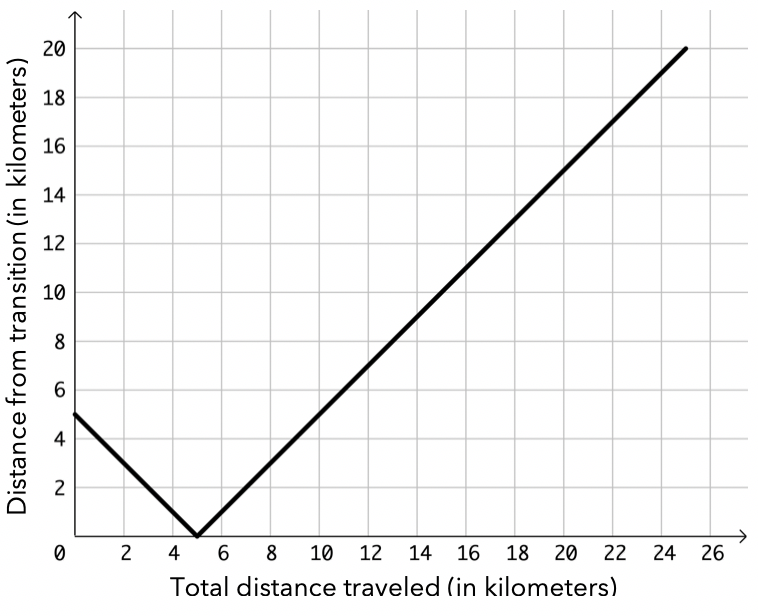
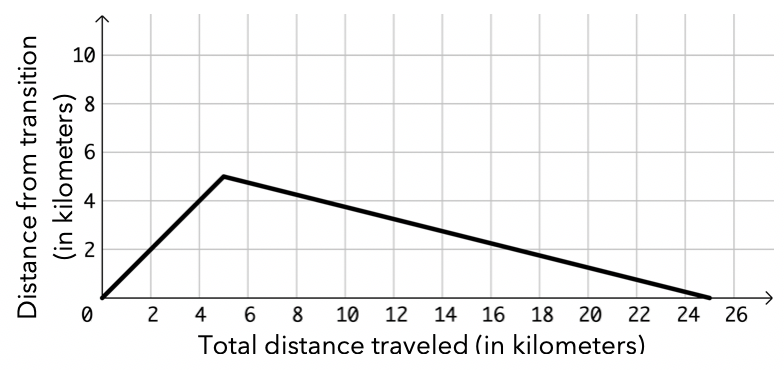
Sophia is going to compete in two legs, running and biking, of a local mini
triathlon. The running begins at the shoreline of the ocean and heads due
north on Ocean Avenue. After she runs 5k she transitions to her bicycle and
continues due north on Ocean Avenue for another 20k. She bikes faster than
she runs. Assuming that Sophia was always heading due north, which of
the following graphs more accurately represents the relationship between
Sophia’s distance from transition and the total distance Sophia has traveled.
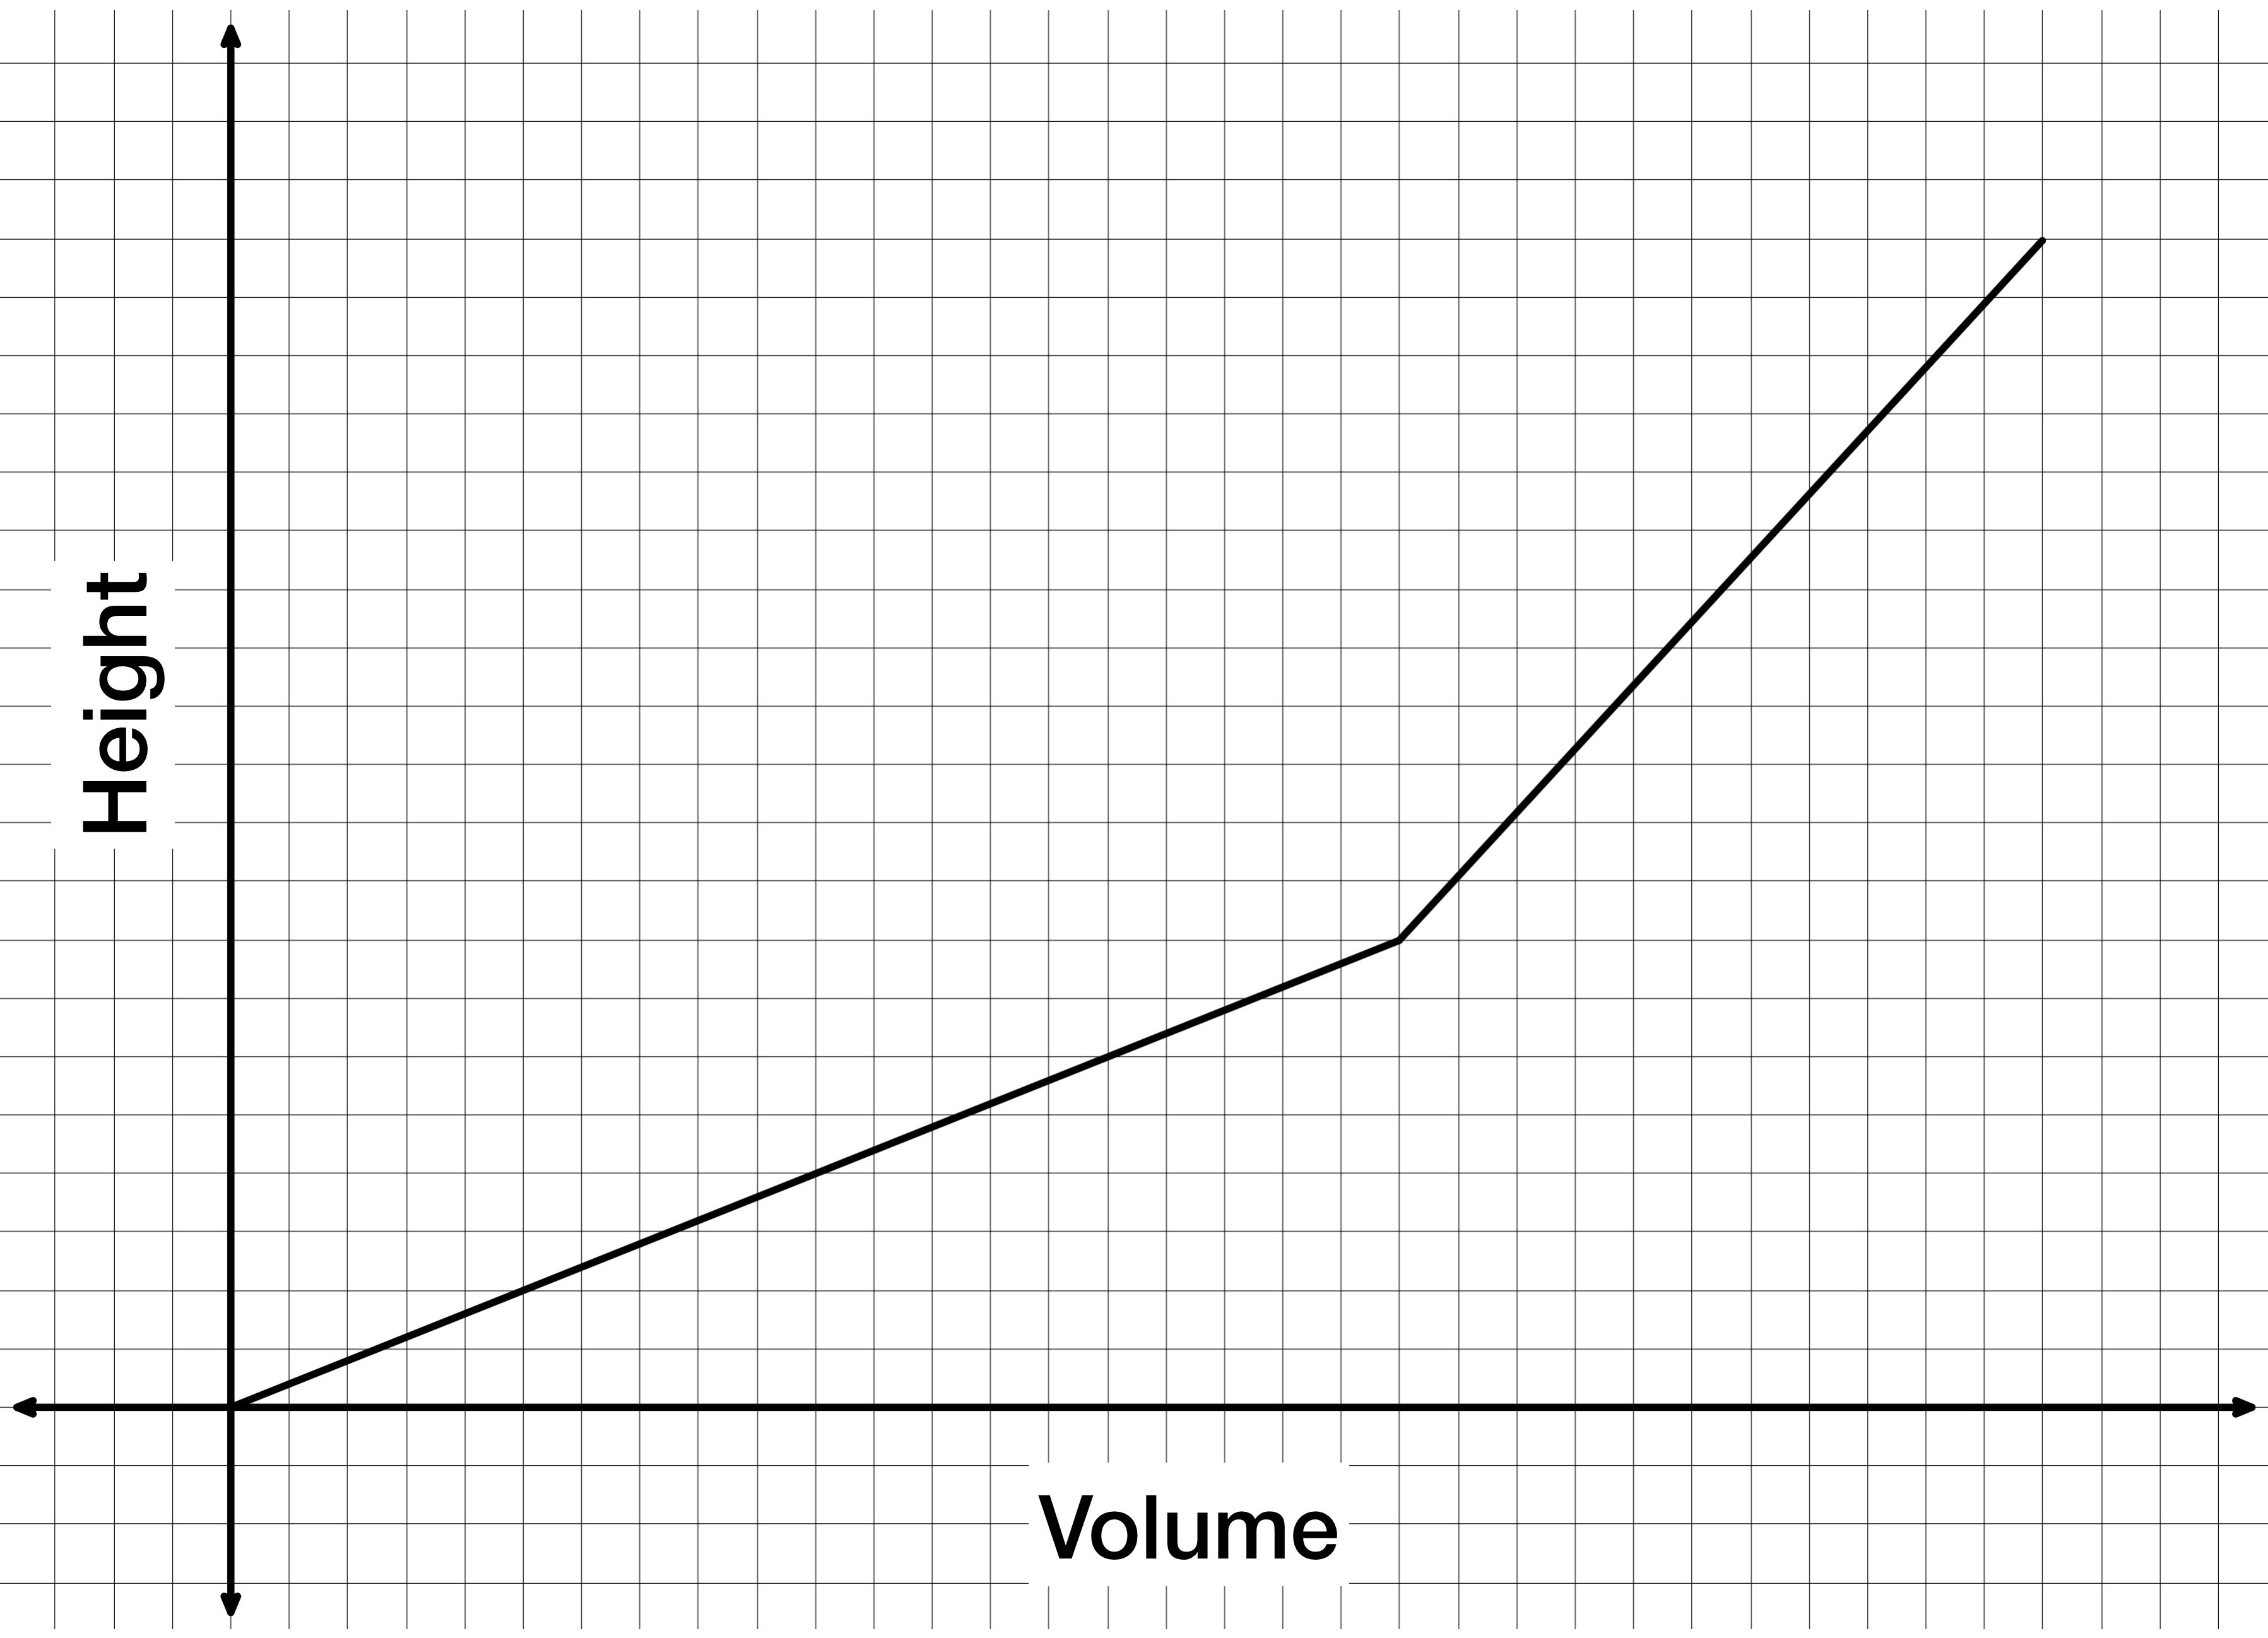
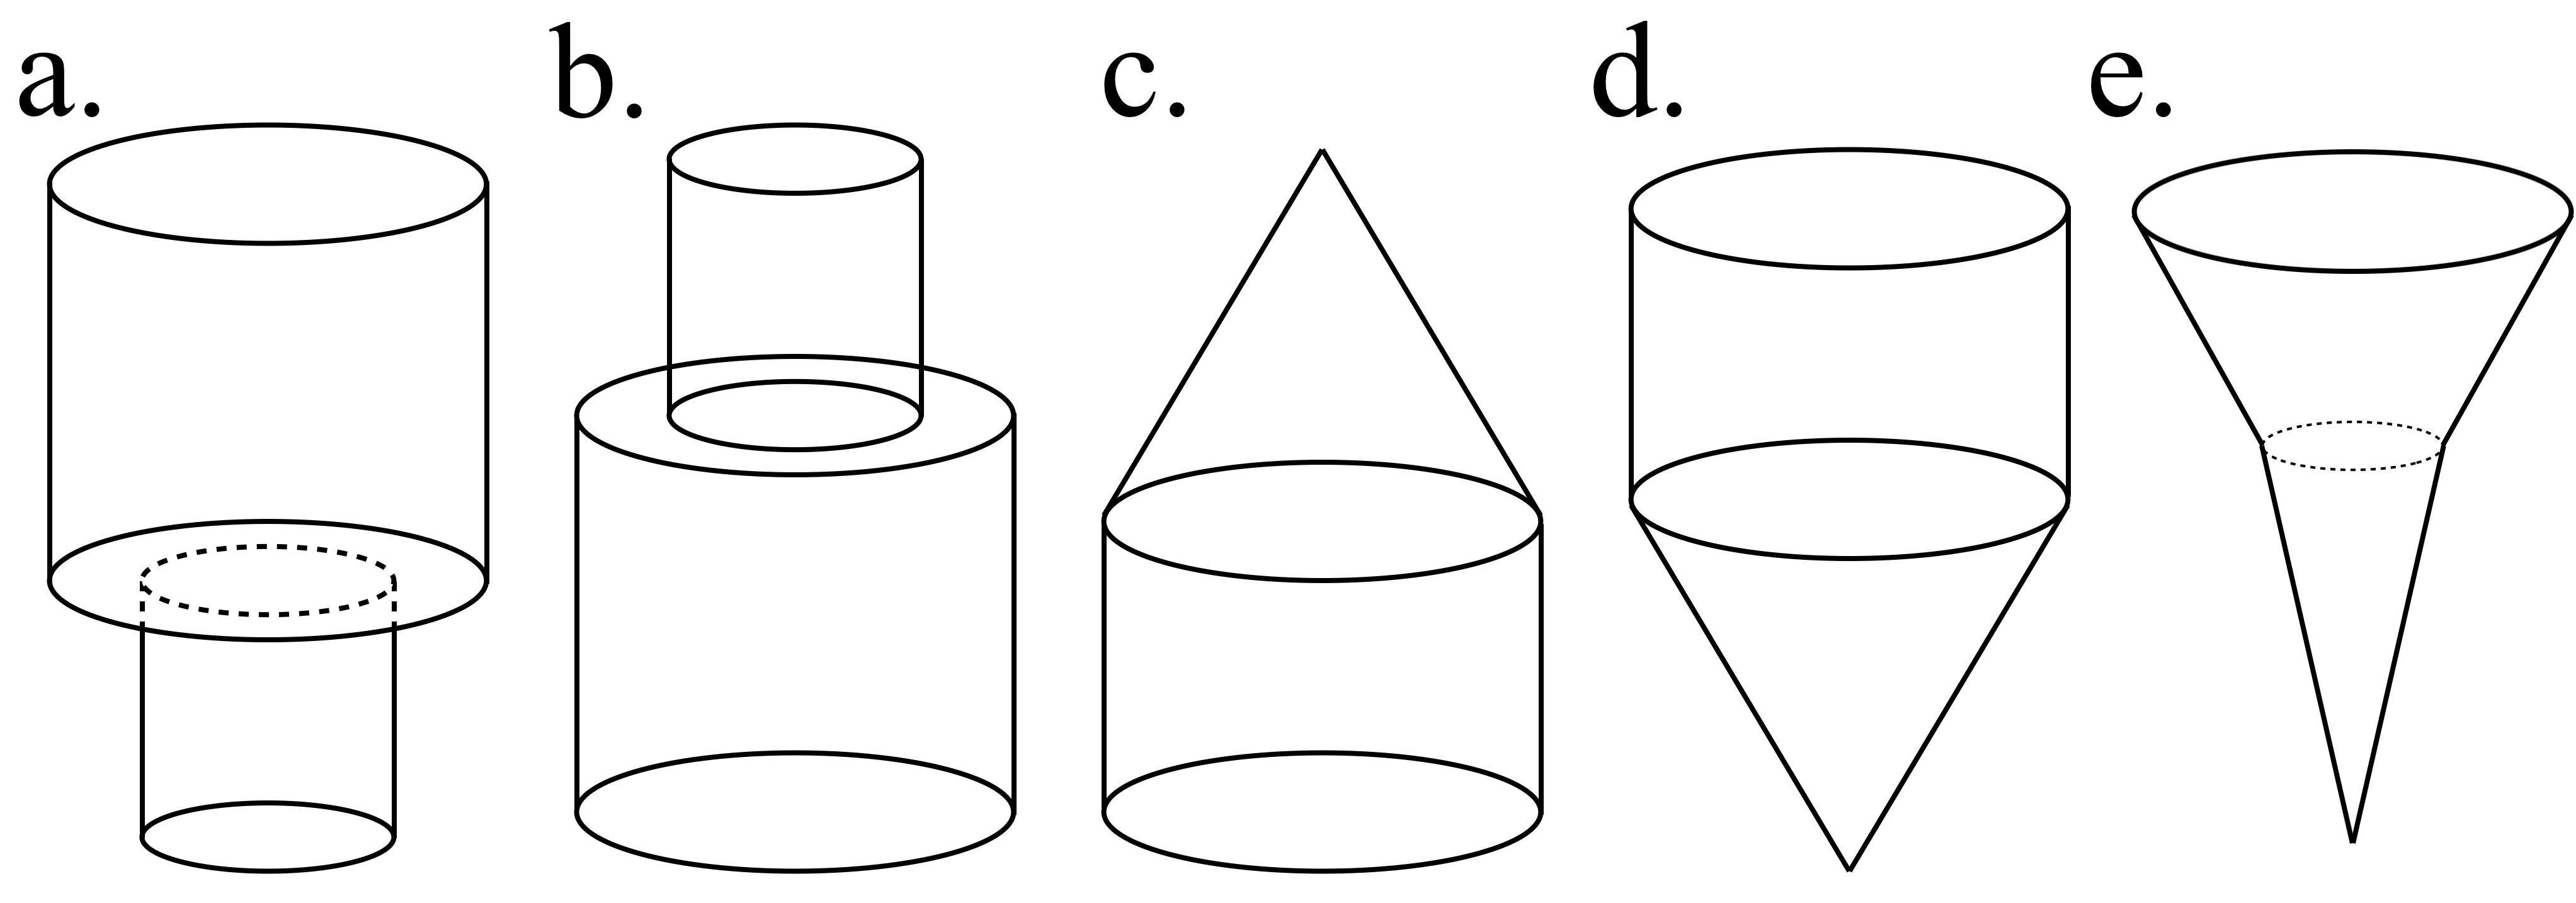
The following graph represents the height of water as a function of volume as water
is poured into a container. Which container is represented by this graph?