You are about to erase your work on this activity. Are you sure you want to do this?
Updated Version Available
There is an updated version of this activity. If you update to the most recent version of this activity, then your current progress on this activity will be erased. Regardless, your record of completion will remain. How would you like to proceed?
Before watching the videos, think about and answer these questions to the best of
your ability.
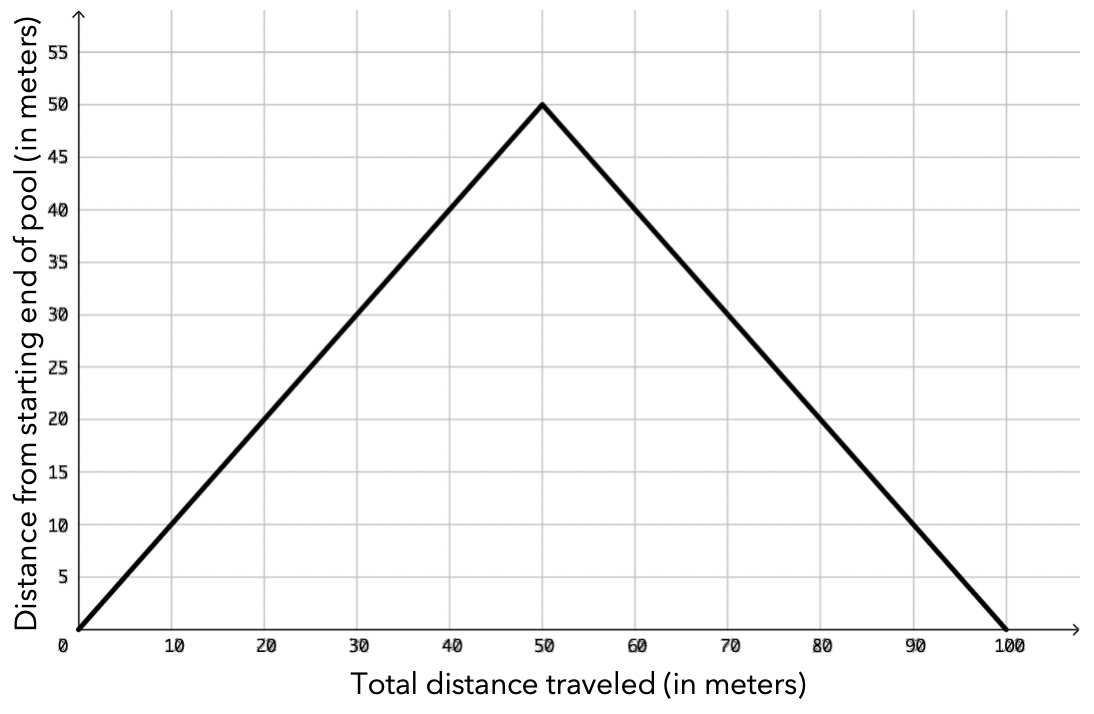
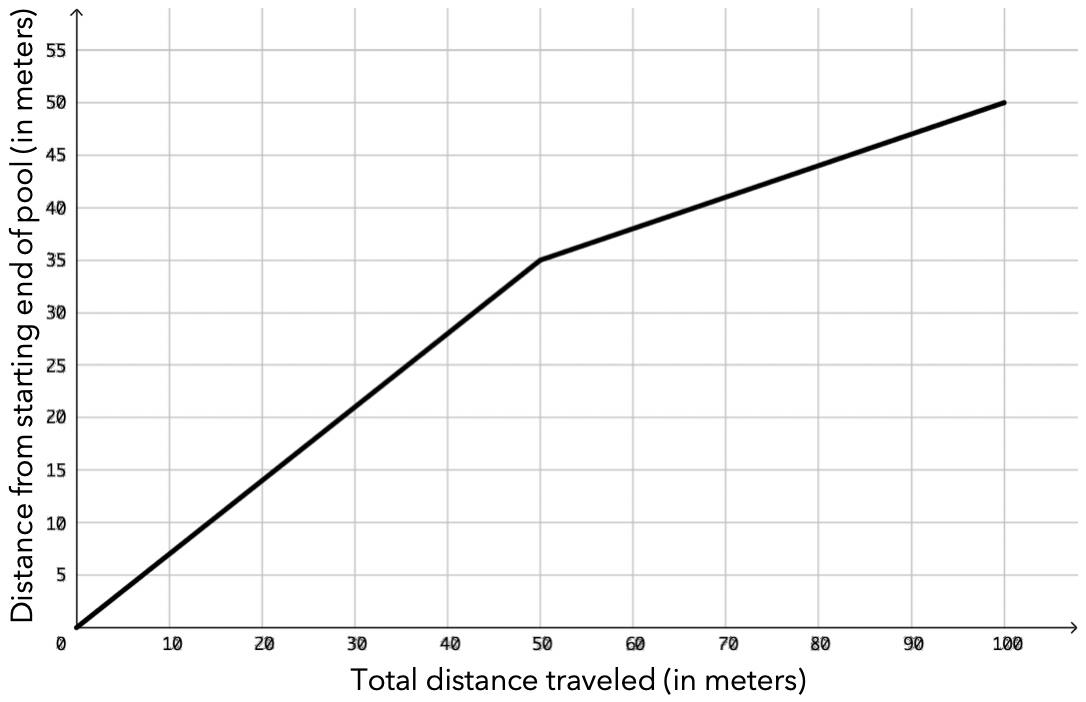
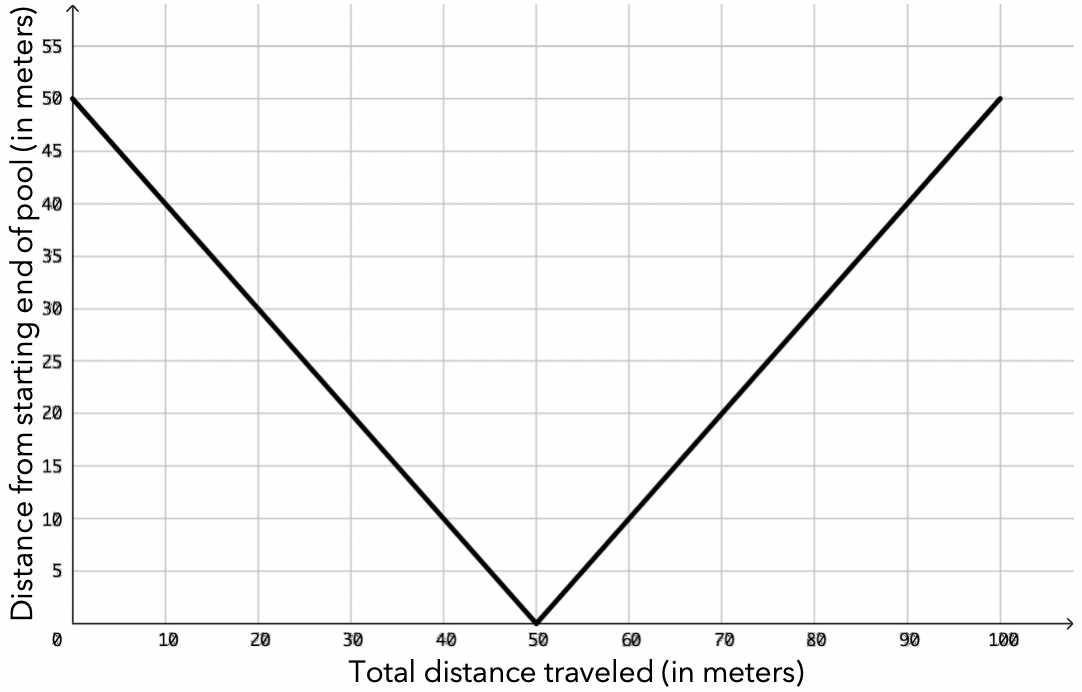
Suppose Allison swims two laps in an Olympic-size swimming pool, which is 50
meters long. She swims the first lap using the freestyle stroke and she swims the
second lap using the breaststroke. Allison swims faster using the freestyle stroke
than she does using the breaststroke. Which of the following graphs more
accurately represents the relationship between Allison’s distance from the end of
the pool where she started swimming and the total distance Allison has
swam.
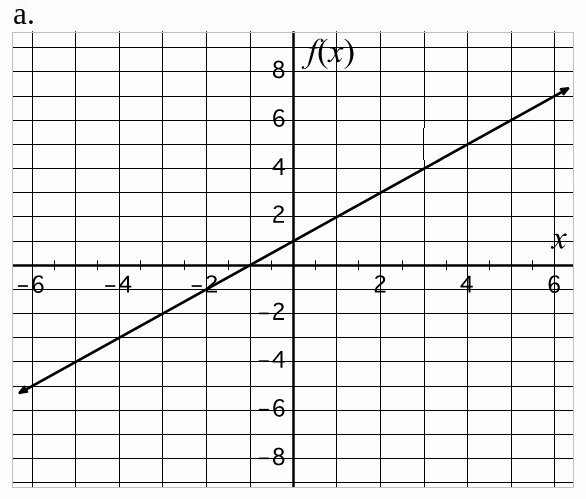
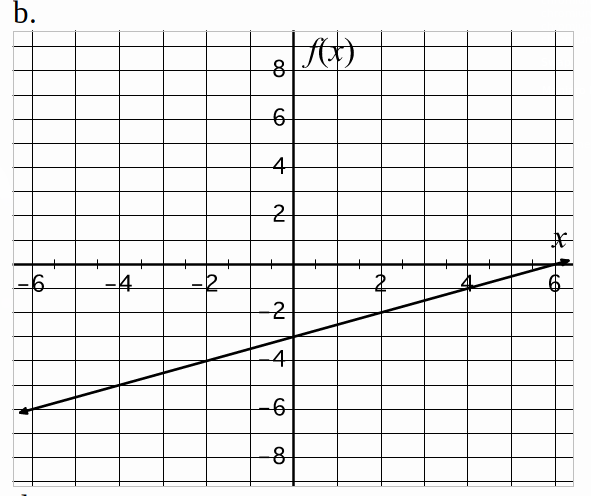
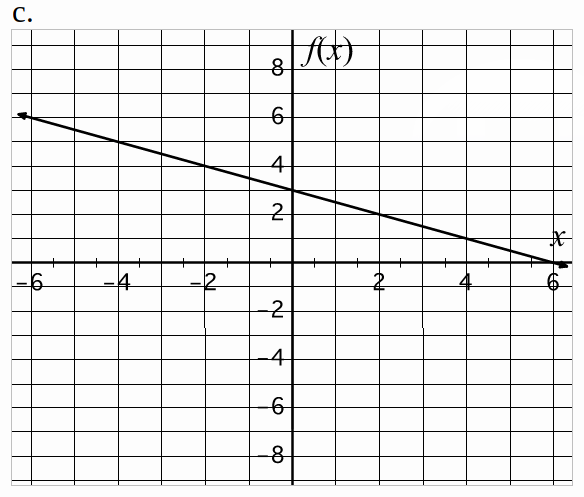
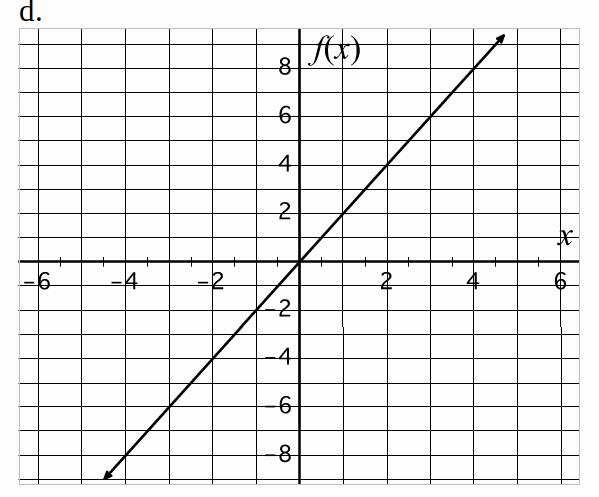
Suppose is a linear function of . Let represent a change in the value of and let
represent the change in the value of . Which of the following graphs could represent
the relationship between and provided ?
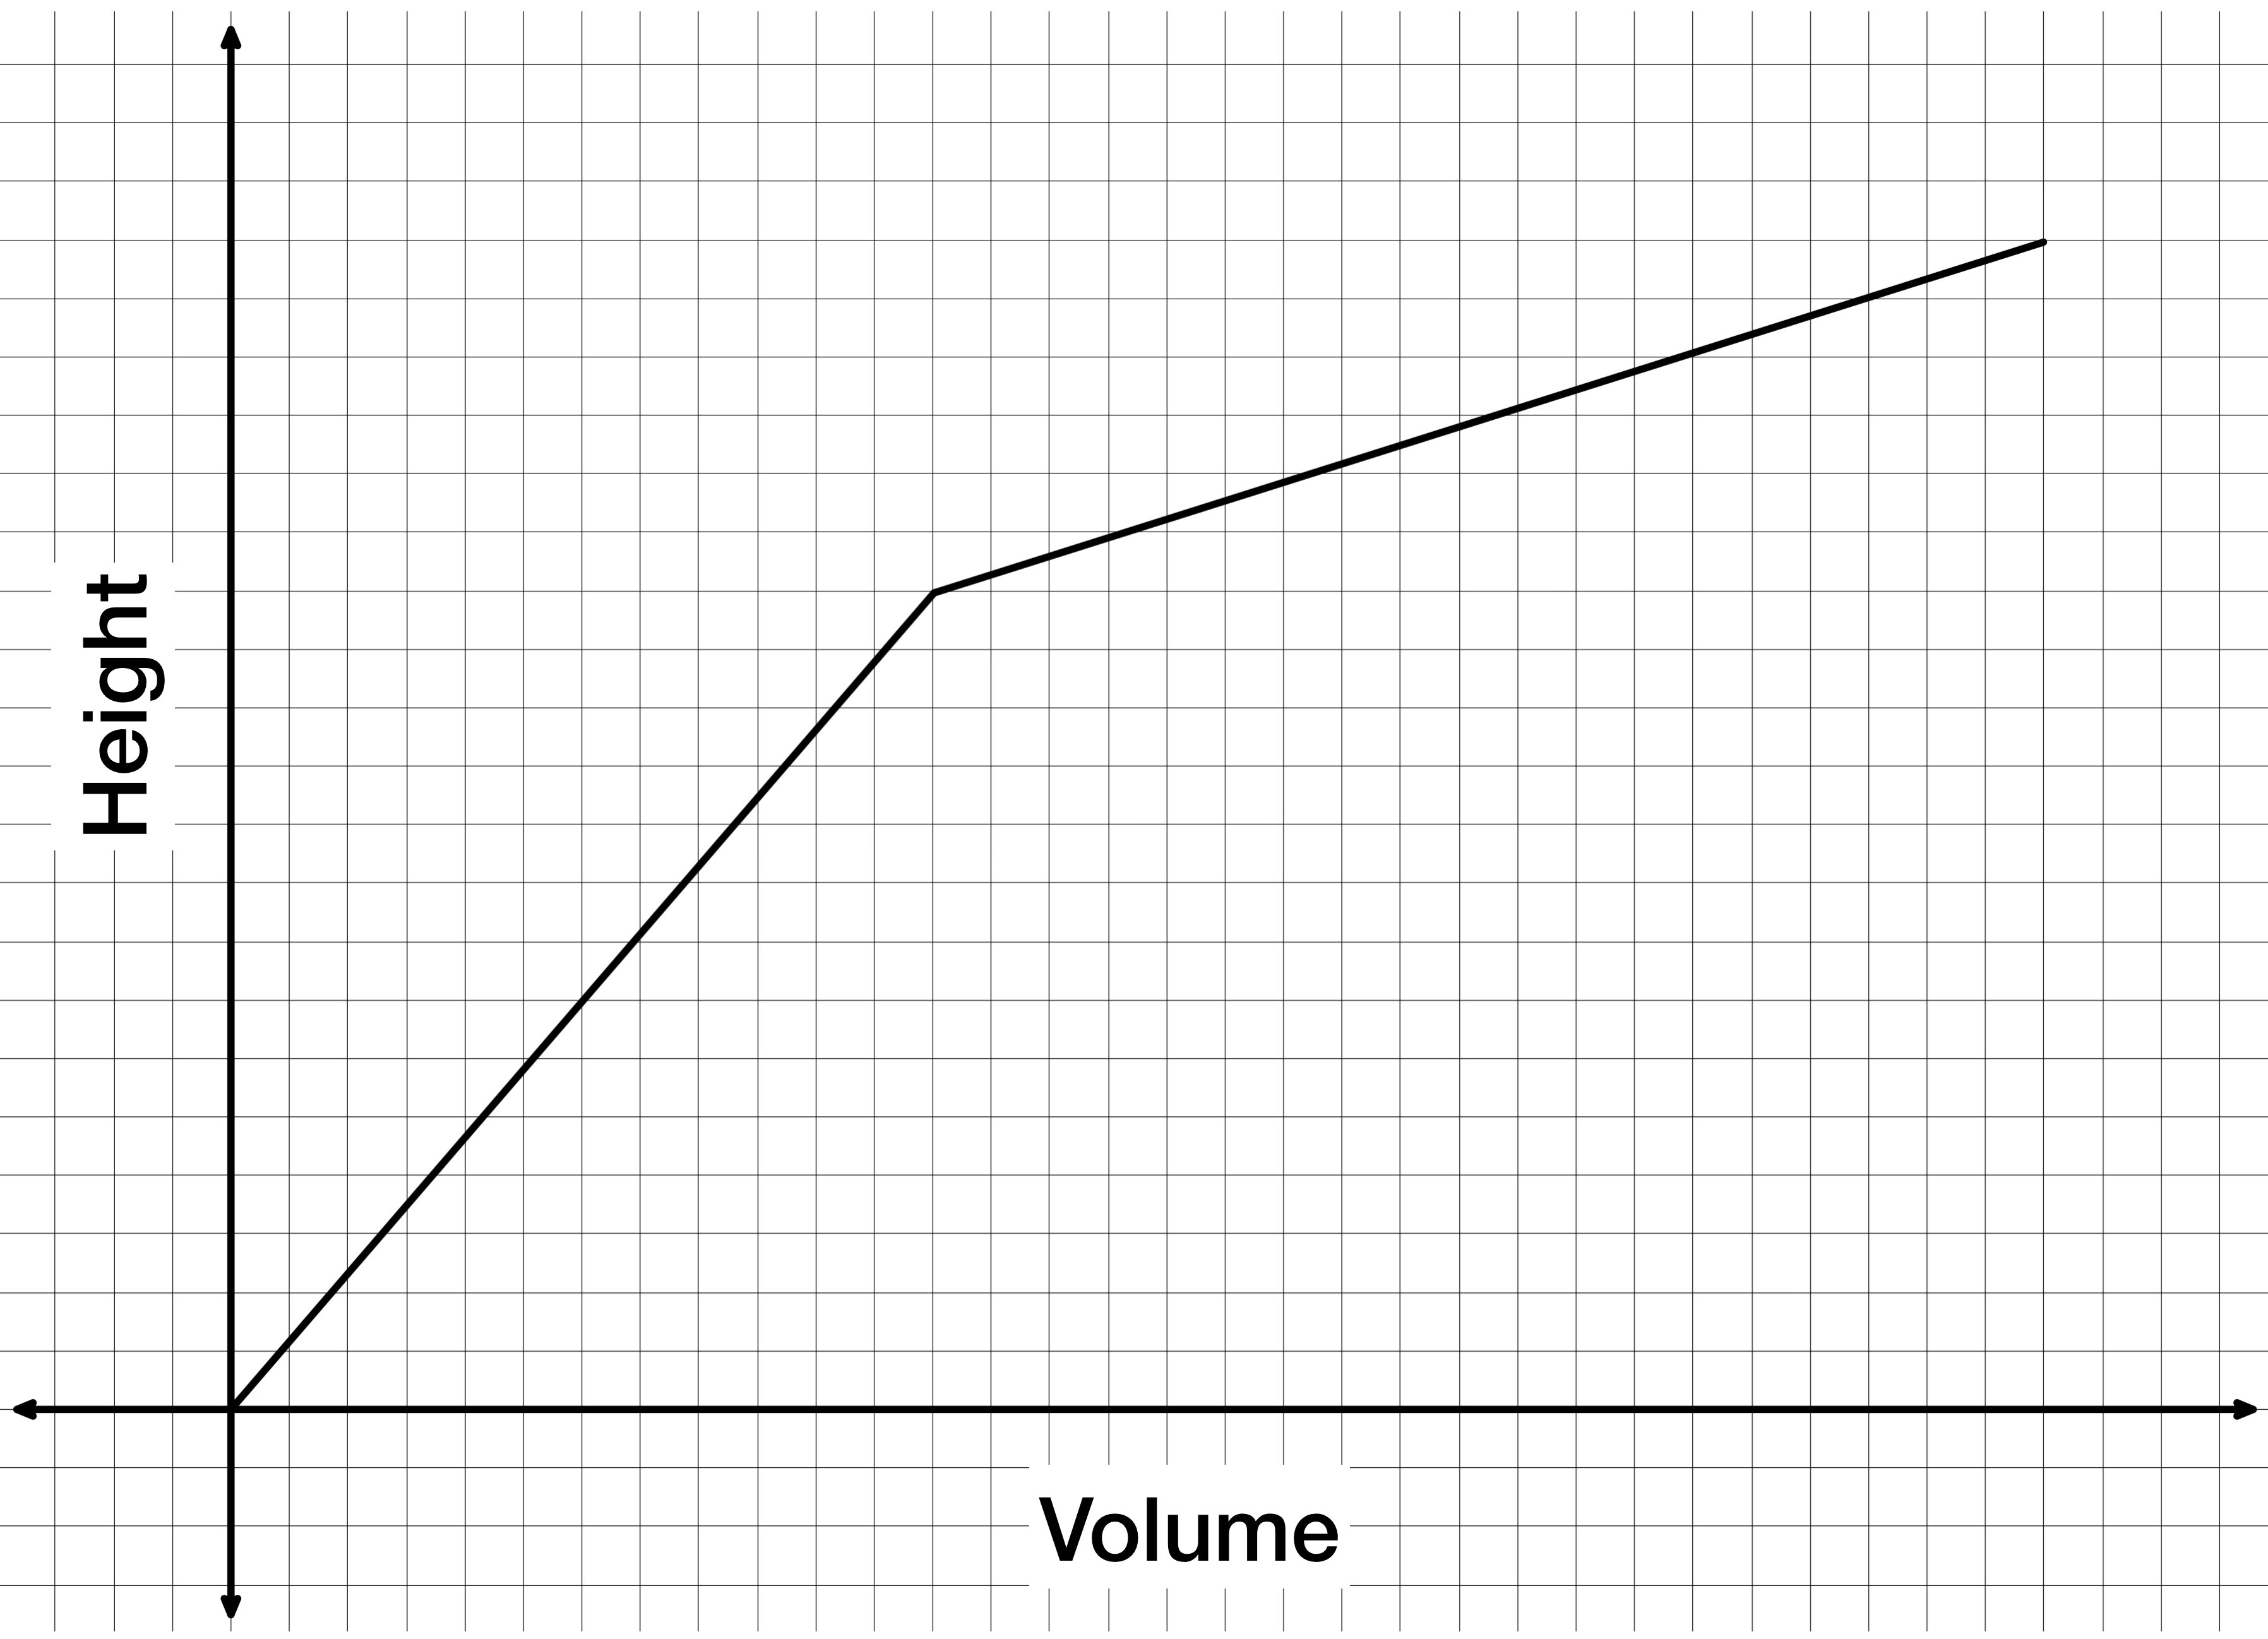
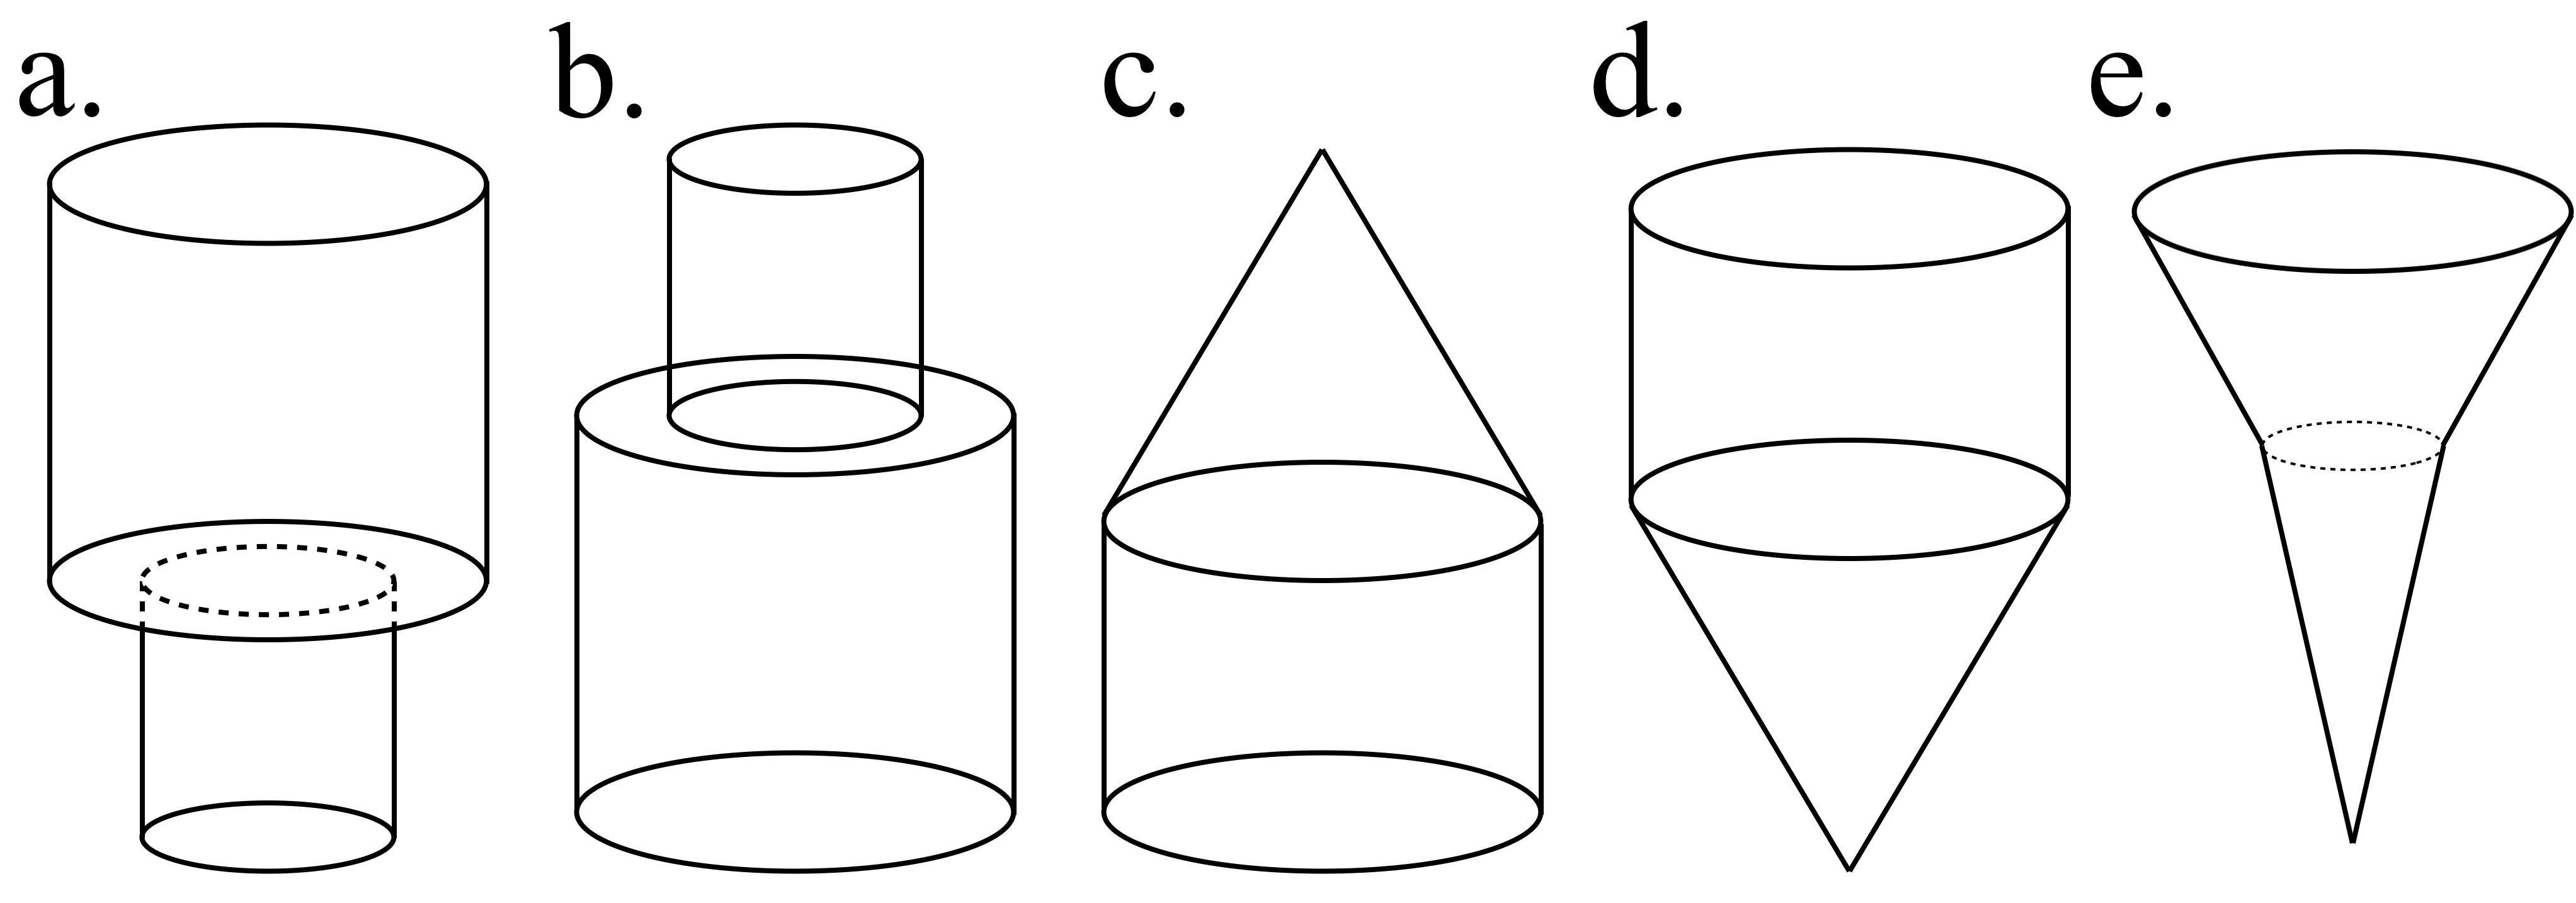
The following graph represents the height of water as a function of volume
as water is poured into a container. Which container is represented by the
graph?
ABCDE
Overall, how confident are you in your answers?
Not at all confidentNot very
confidentSomewhat confidentVery Confident