A brief introduction to the calculus of continuous random variables.
- When rolling a six-sided die, there is a random variable associated to this action which represents the side of the die that comes up on top. In this case, possible values of are or , and (if it’s a fair die) each outcome is equally likely. This is an example of a discrete random variable, which means that the possible values are finite or otherwise clearly separated from one another.
- For any given brand of lightbulb, there is an associated random variable which represents the lifetime of the bulb (i.e., equals the total time that a particular bulb lasts before it burns out). We idealize this random variable to be a continuous random variable, because the lifetime could be any positive amount of time in principle (i.e., we might have one bulb lasting hours and another lasting only seconds longer than that).
We will focus primarily on continuous random variables. The information we will typically need to know in order to work with continuous random variables are:
- The interval of possible values that the random variable may take. For the lightbulb burn-out example, this would be the interval .
- A probability density function to compute the probability of various events.
A probability density function on an interval is a function which is
As the name suggests, a PDF represents a density of probability; so if is relatively
large at a particular value of , this indicates that values near that are relatively more
likely to occur than values near where is smaller.
- (a)
- Non-negative, i.e., for every in the interval ,
- (b)
- Can be integrated on the interval ; this is possible if, for example, is continuous on ,
- (c)
- Has total integral , i.e., (Note: we can allow and/or if these make sense for a particular random variable. In this case, we interpret the integral as an improper integral.)
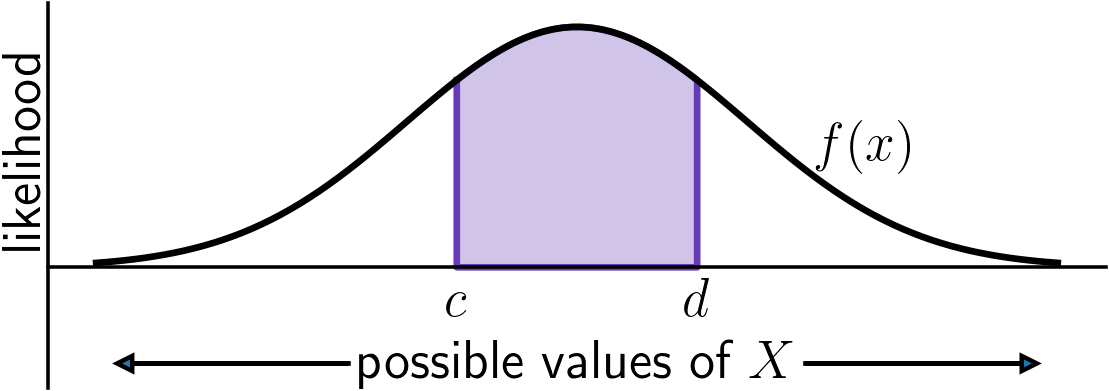
Suppose is a random variable taking values between and which has a probability
density function on the interval . Then for any two numbers inside the interval ,
the probability that takes a value between and is given by integration:
 When plotting a PDF, the horizontal axis ranges over possible values of the random variable and
the vertical axis measures relatively likelihood. The area under the graph equals the probability that
takes values between and .
