Recap Video
Take a look at the following video which recaps the ideas from the section.
_
Example Video
Below is a video showing a worked example.
Problems
We can make use of a number line of sorts to help us classify these
equilibrium points as stable, unstable, or semistable.
Consider .
- How many equilibrium points does the differential equation have? What are they?
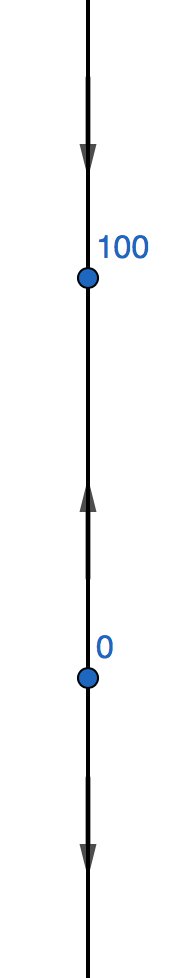
- Use a phase line to classify these equilibrium points. To make a phase line, we will first make a vertical line representing and plot our equilibrium points.What do the arrows represent? We will plug numbers in each region of the line into our differential equation. For example, if we plug in into the equation, we get which is a positivenegative number. Since , this tells us is increasingdecreasing , hence the downward arrow in the region above . Similarly, if we plug in , we get which is a positivenegative number. Since , this tells us is increasingdecreasing , hence the downward arrow in the region below . Lastly, if , we get which is a positivenegative number. Since , this tells us is increasingdecreasing , hence the upward arrow in the region between and .
All this tells us that is a stableunstablesemistable equilibrium point, and is a stableunstablesemistable equilibrium point. - If , what do you expect to be?
An object is dropped with zero initial velocity. The vertical velocity (in ft/s)
at time satisfies
How many equilibrium points does this differential equation have?
.
We can also classify equilibrium points with a derivative test:
Suppose is an
equilibrium point for .
- If , then is an unstable equilibrium point.
- If , then is a stable equilibrium point.
- If , then the test is inconclusive, and you need to use the phase line approach.