Recap Video
Take a look at the following video which recaps the ideas from the section.
Example Video
Below is a video showing a worked example.
Problems
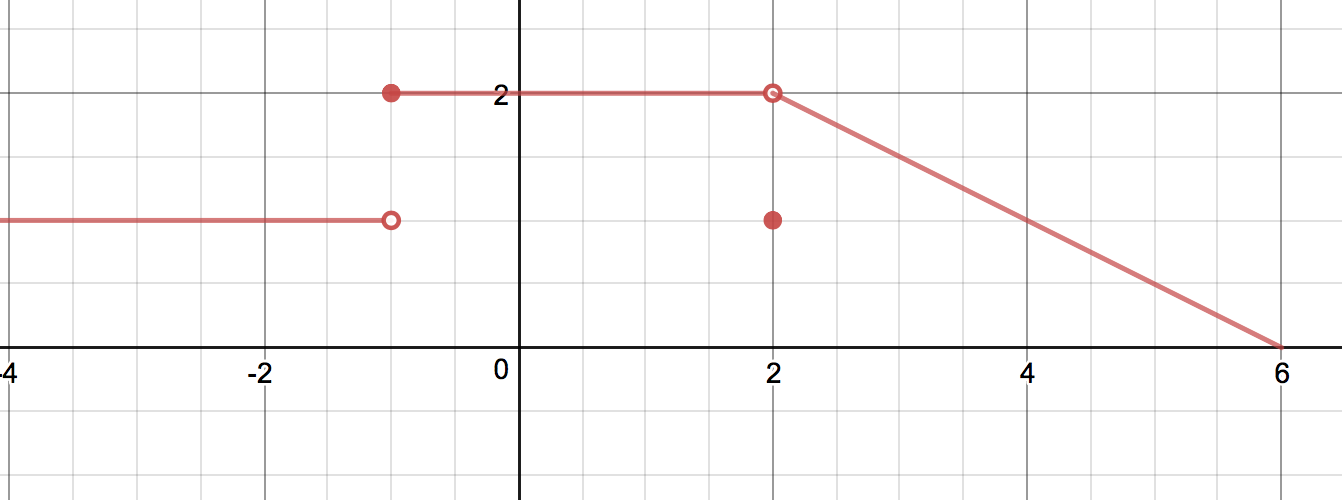
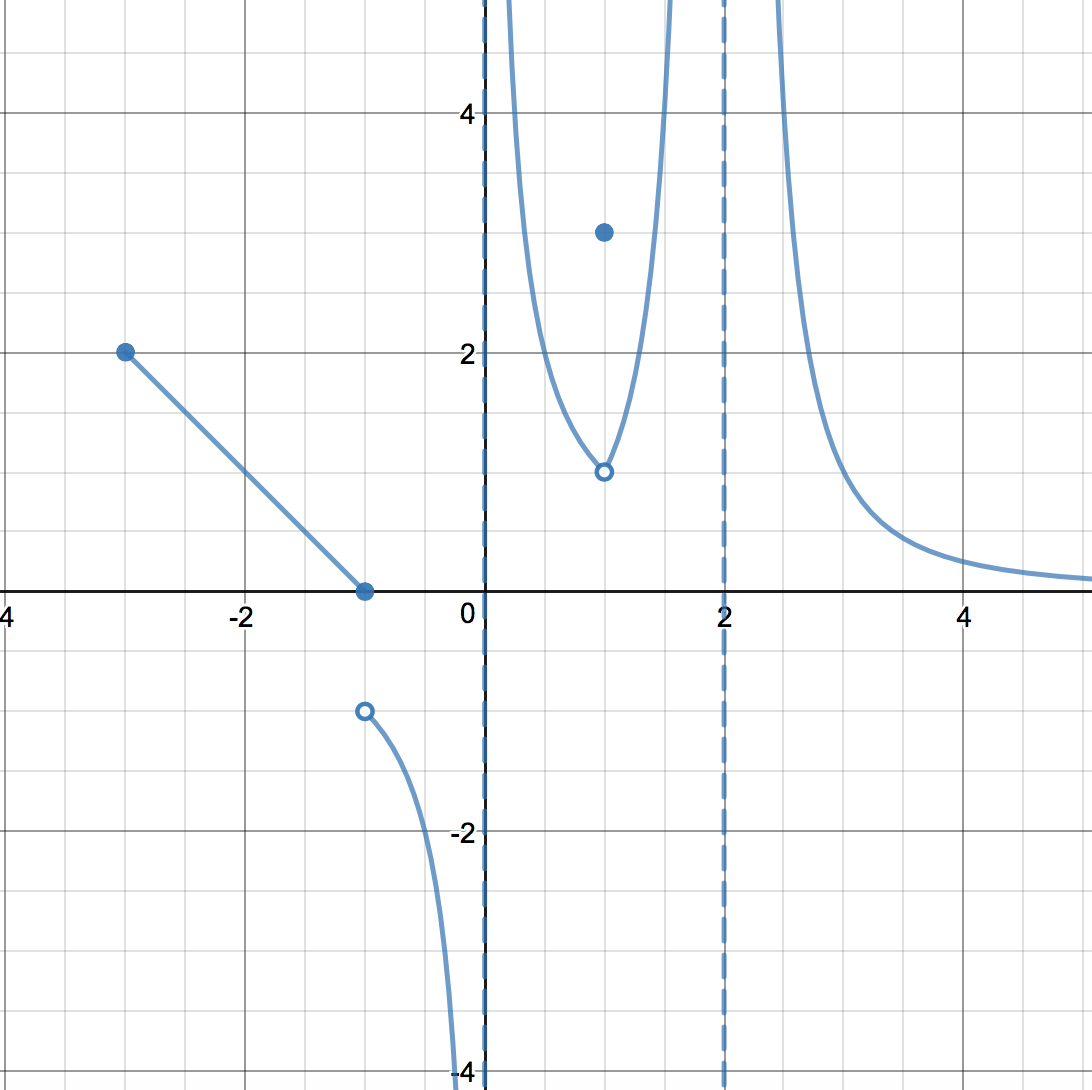
Given a function :
- The limit is the value the function approaches as gets closer to (if it exists).
- The left-hand limit is the value the function approaches as gets closer to for values (if it exists).
- The right-hand limit is the value the function approaches as gets closer to for values (if it exists).
- The limit exists if and only if .
- We write a limit equals (resp. ) if the values of get arbitrarily large (resp. arbitrarily large in the negative direction) as approaches .
Evaluate .
We will learn a quicker way to computing this limit in the next
section, but for now, we have two approaches:
- Using a graph. Let . Which of the following represents the graph of ? Based on this graph, it appears that as gets closer to , the -values of get closer to .
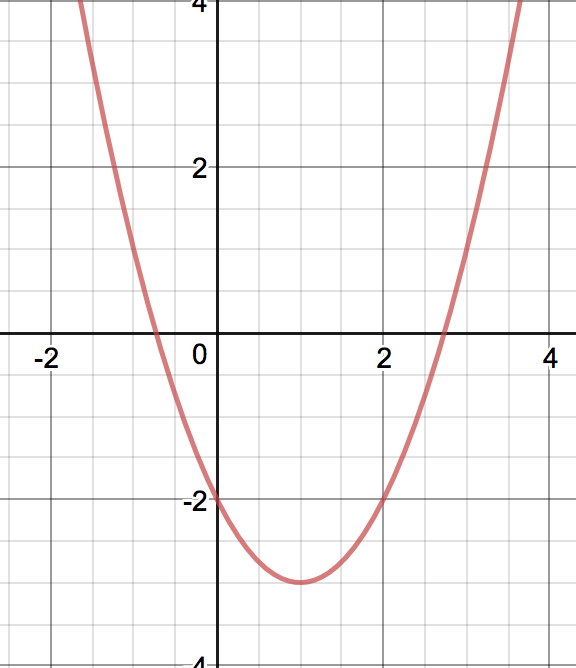
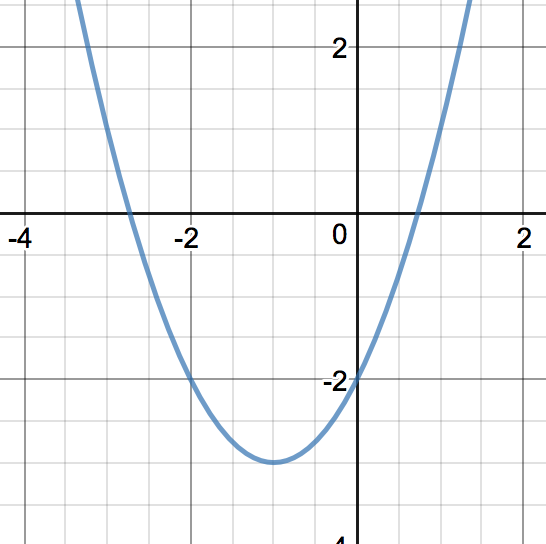

- Using a table. Using a calculator, fill in the following tables (round to
four digits after the decimal point):Based on these tables, we see that as the -values get closer to , the -values appear to be approaching which doesdoes not match our answer using the graph above.
Calculate .
Again, let’s look at both approaches.
- Using a graph. The graph of is shown below. Notice that this function is undefined at , hence the hole at on the graph. However, as gets closer to , we note that the -values are getting closer to a certain value, and that value is .
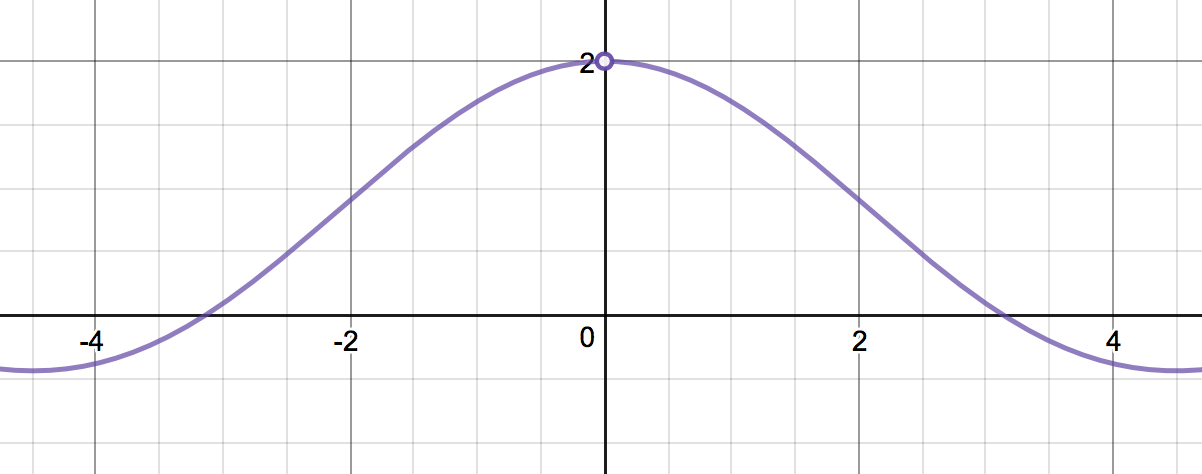
- Using a table. Here is a table showing the values of for different
-values:Based on these tables, we see that as the -values get closer to , the -values appear to be approaching which doesdoes not match our answer using the graph above.
