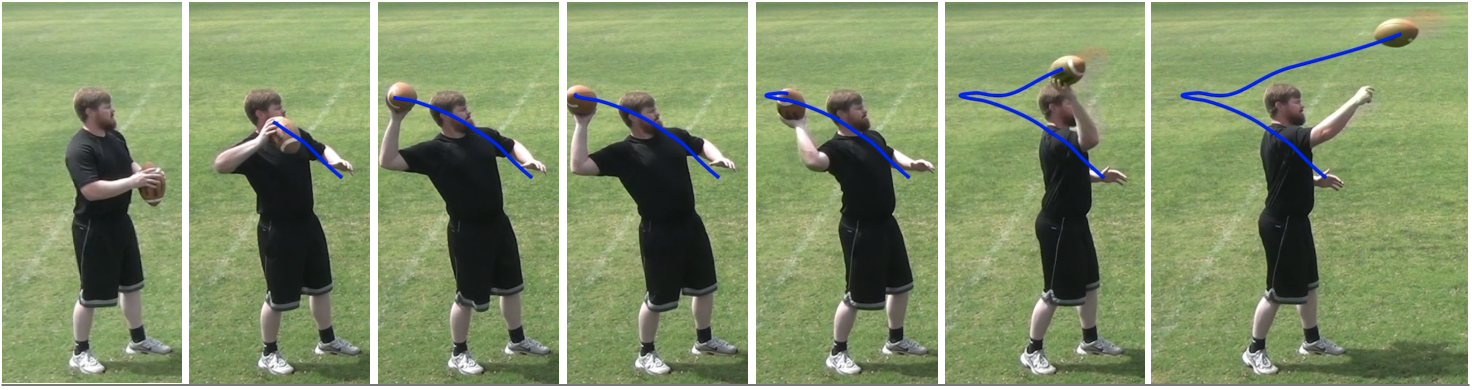
Below are images of a football player throwing a football. The images are taken 0.9 seconds apart and the blue curve represents the path of the football from the beginning of his throwing motion.
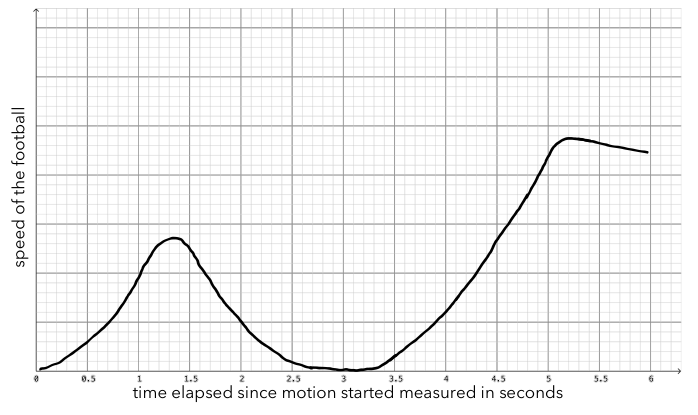
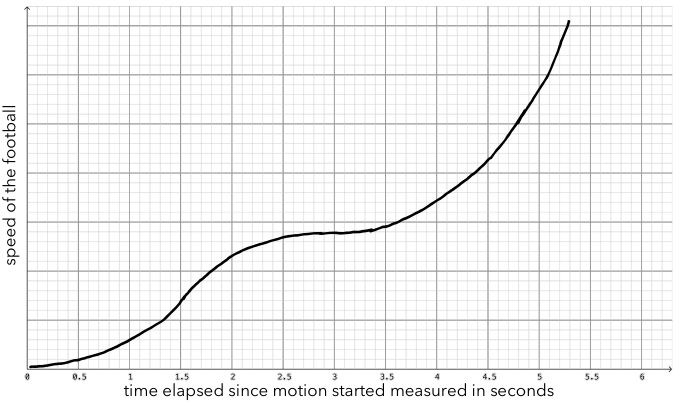
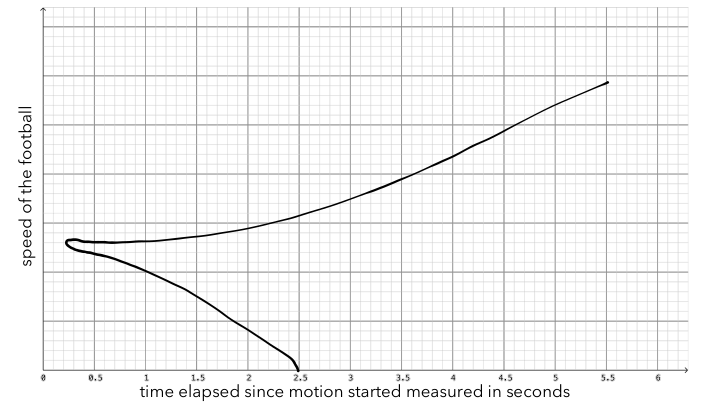
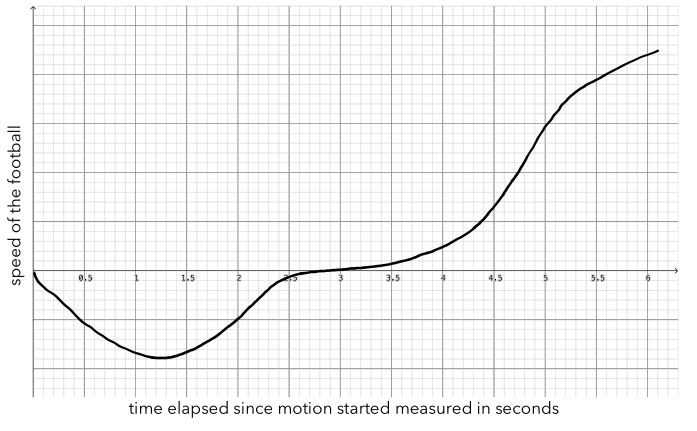
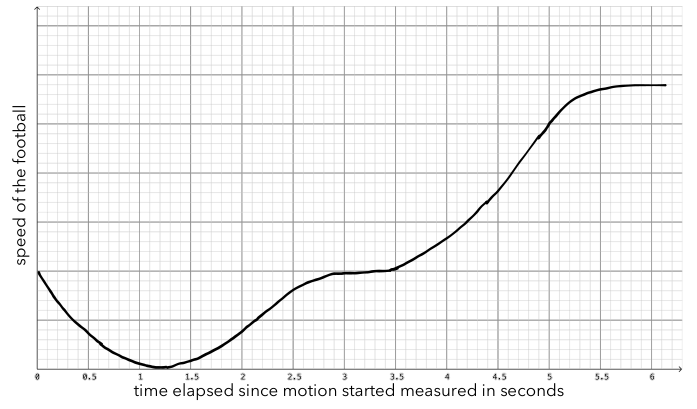
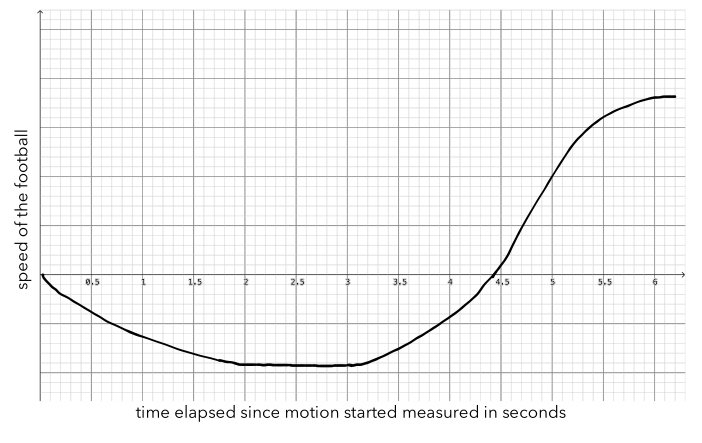
Several students attempted to represent the speed of the football for all moments in time from the beginning of the throwing motion. Which of the student graphs below best represents the speed of the football for all moments in time?