We investigate quadric surfaces.
Work in groups of 3–4, writing your answers on a separate sheet of paper.
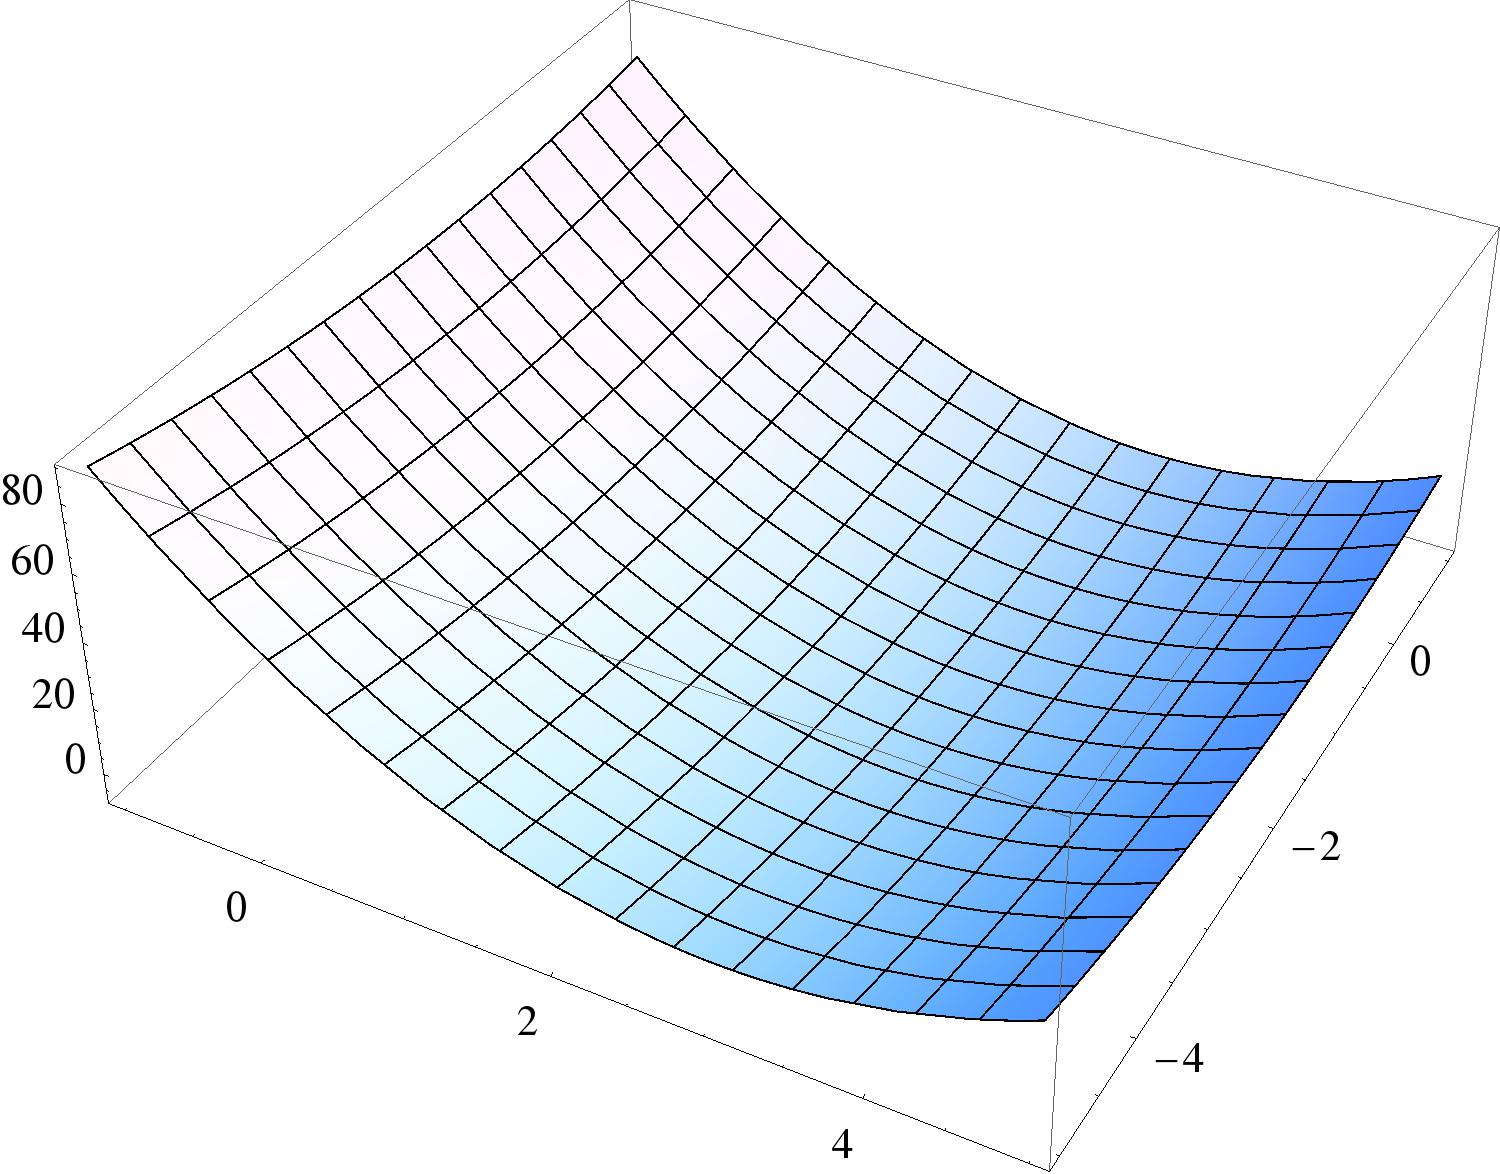
Consider . Here is a plot of the quadric surface :
Here we see a table of values for with the same domain: The -coordinates should
run along the bottom of this table and the coordinates should run along the
left-hand side. Fill them in.
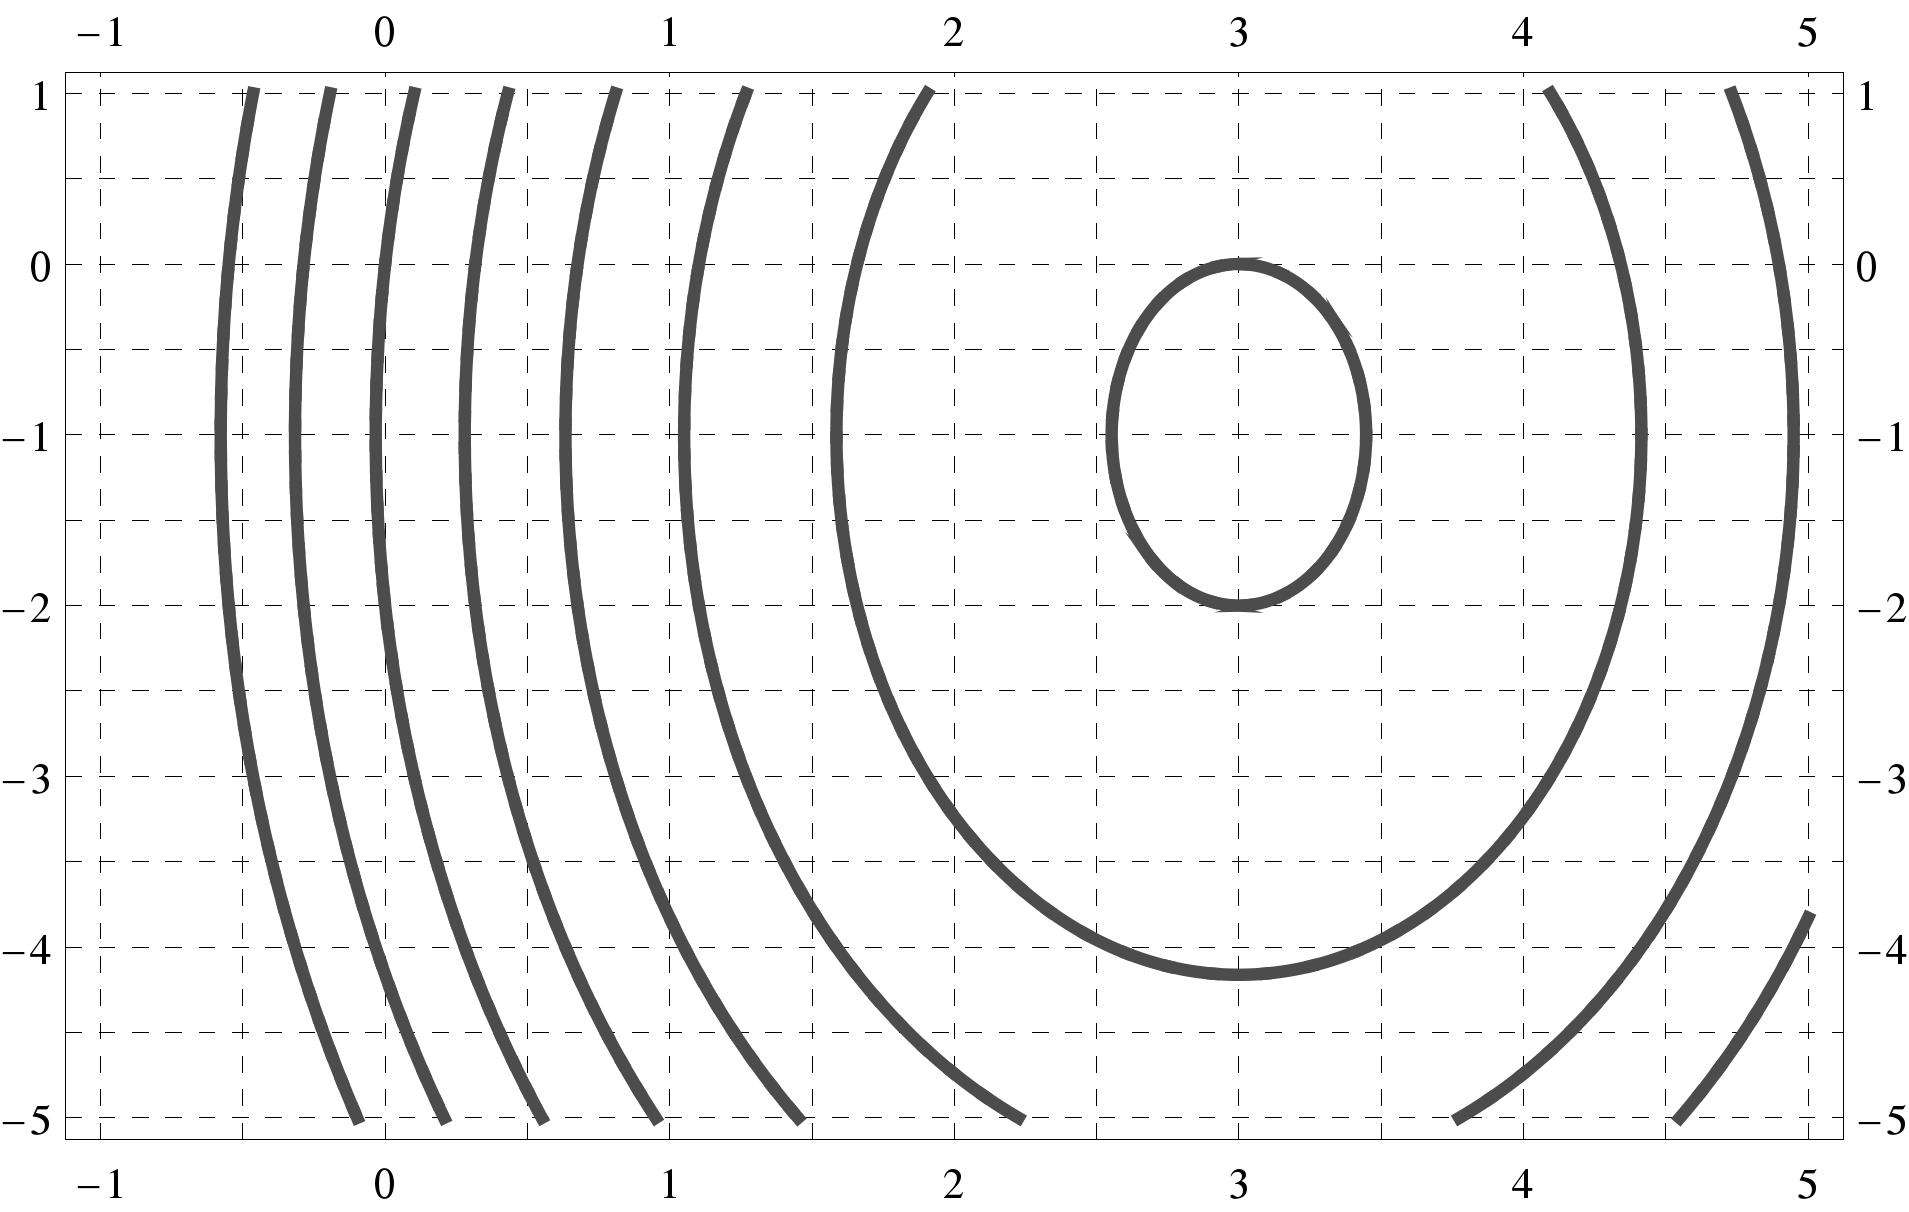
Estimate the height of each of the level curves in the contour plot for above. Write
the heights directly on the contour plot.
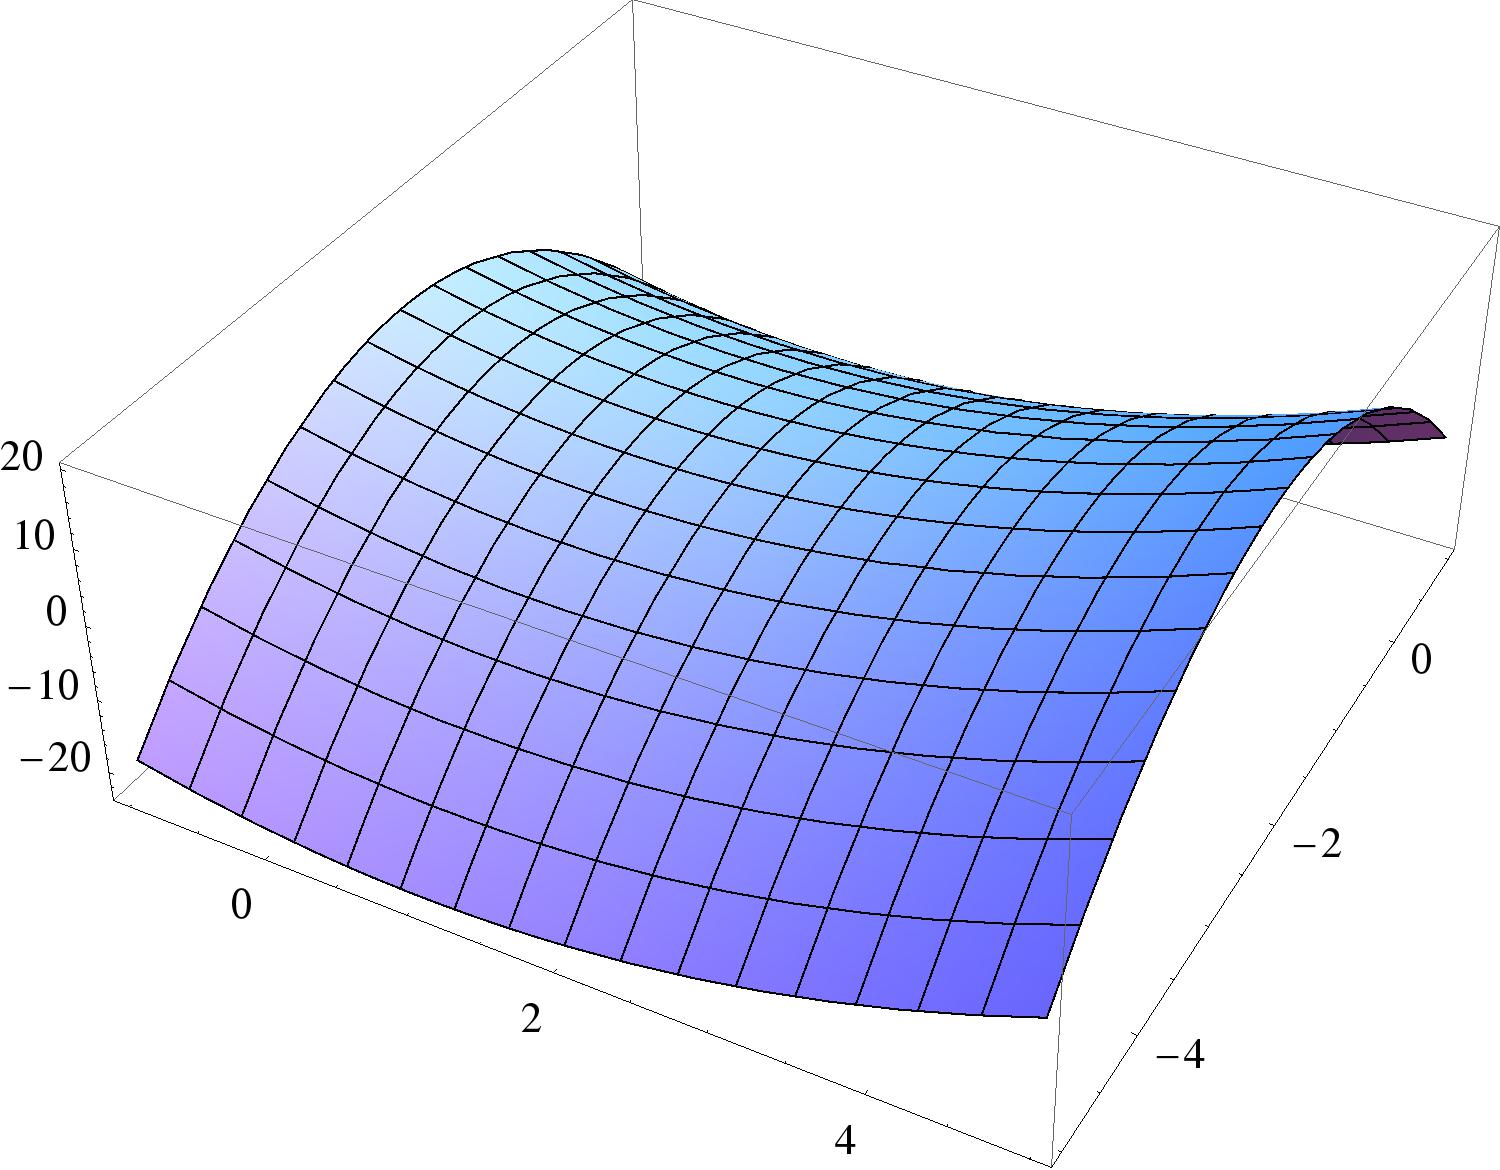
Consider . Here is a plot of the quadric surface :
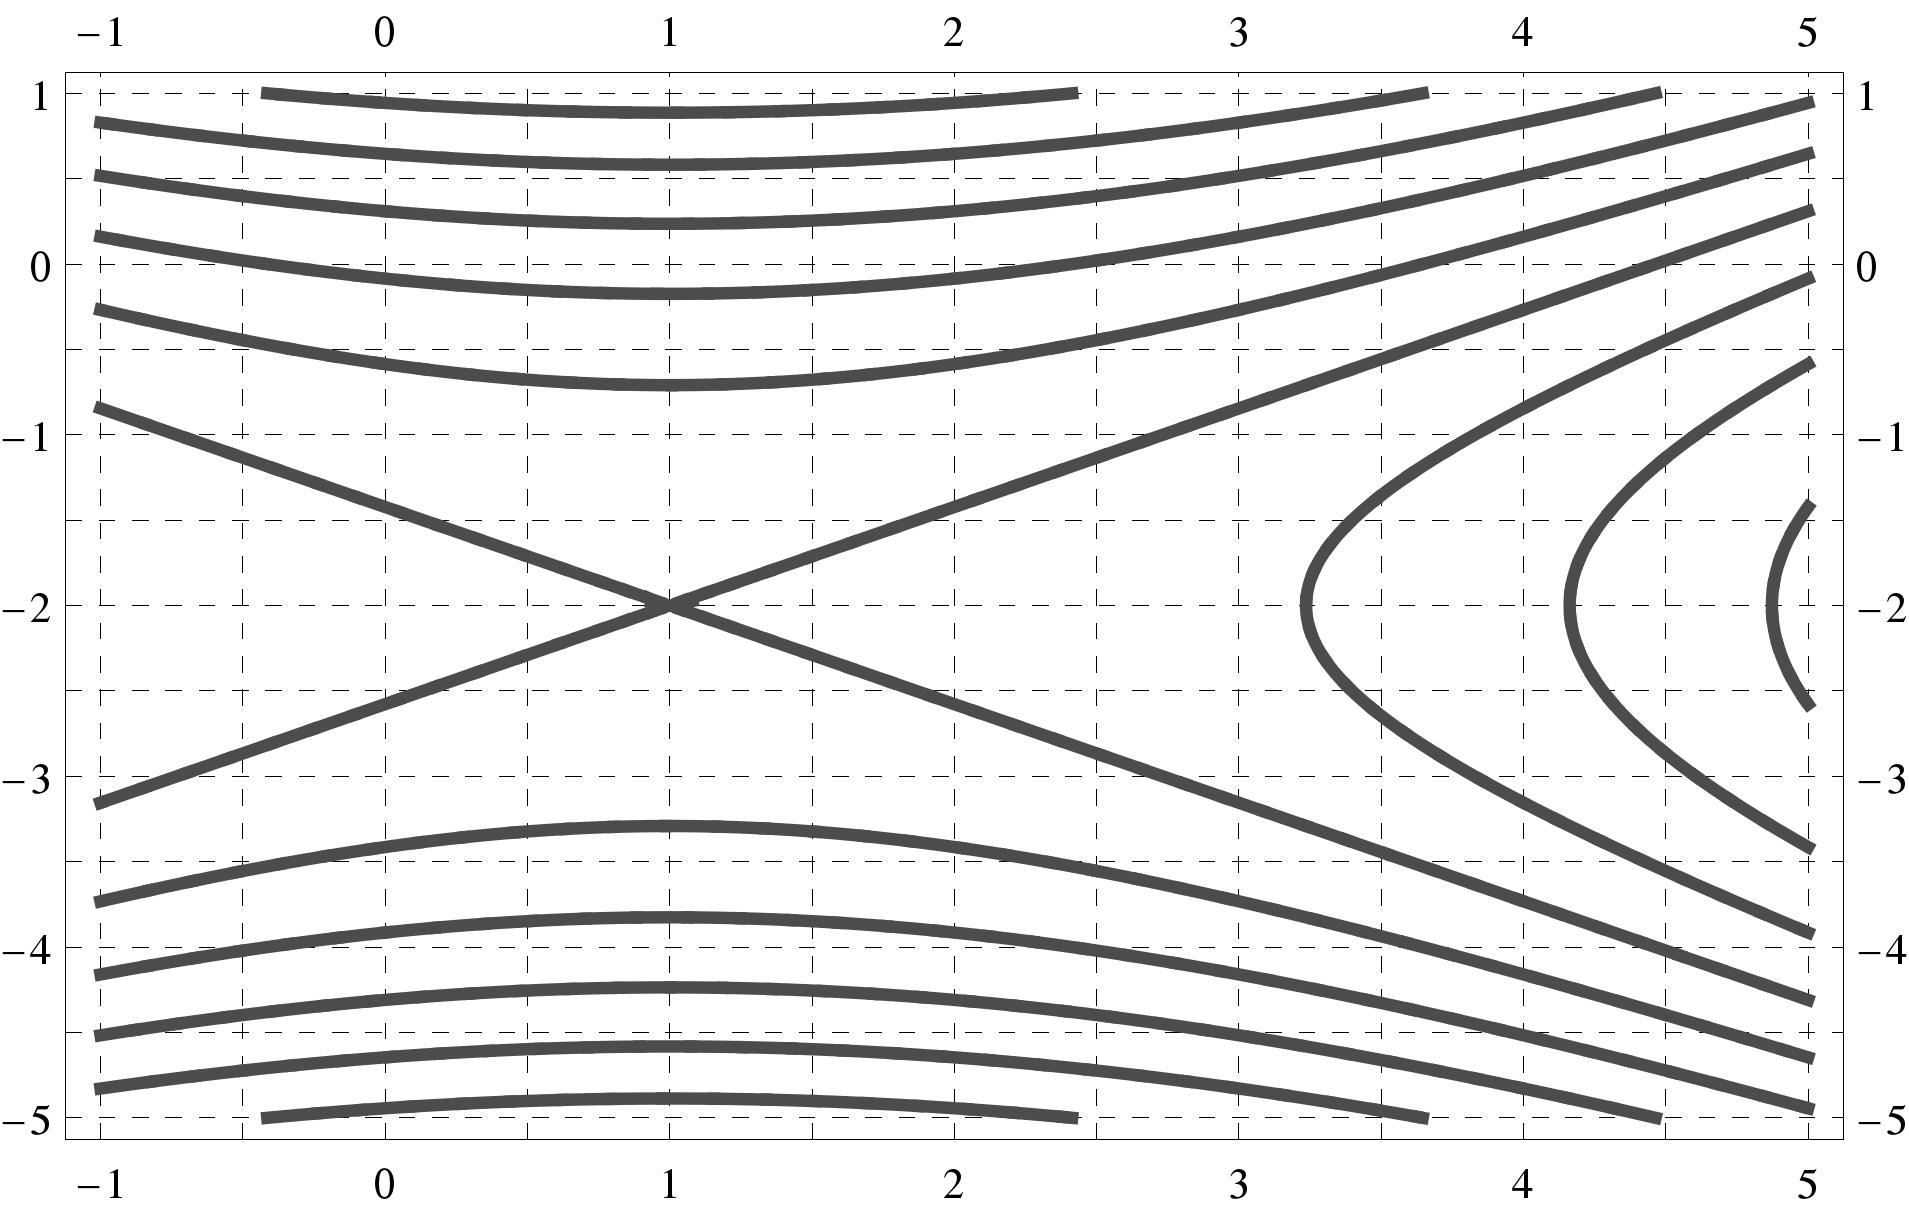
Here we see a table of values for with the same domain:
The -coordinates should run along the bottom of this table and the coordinates should run along the left-hand side. Fill them in.