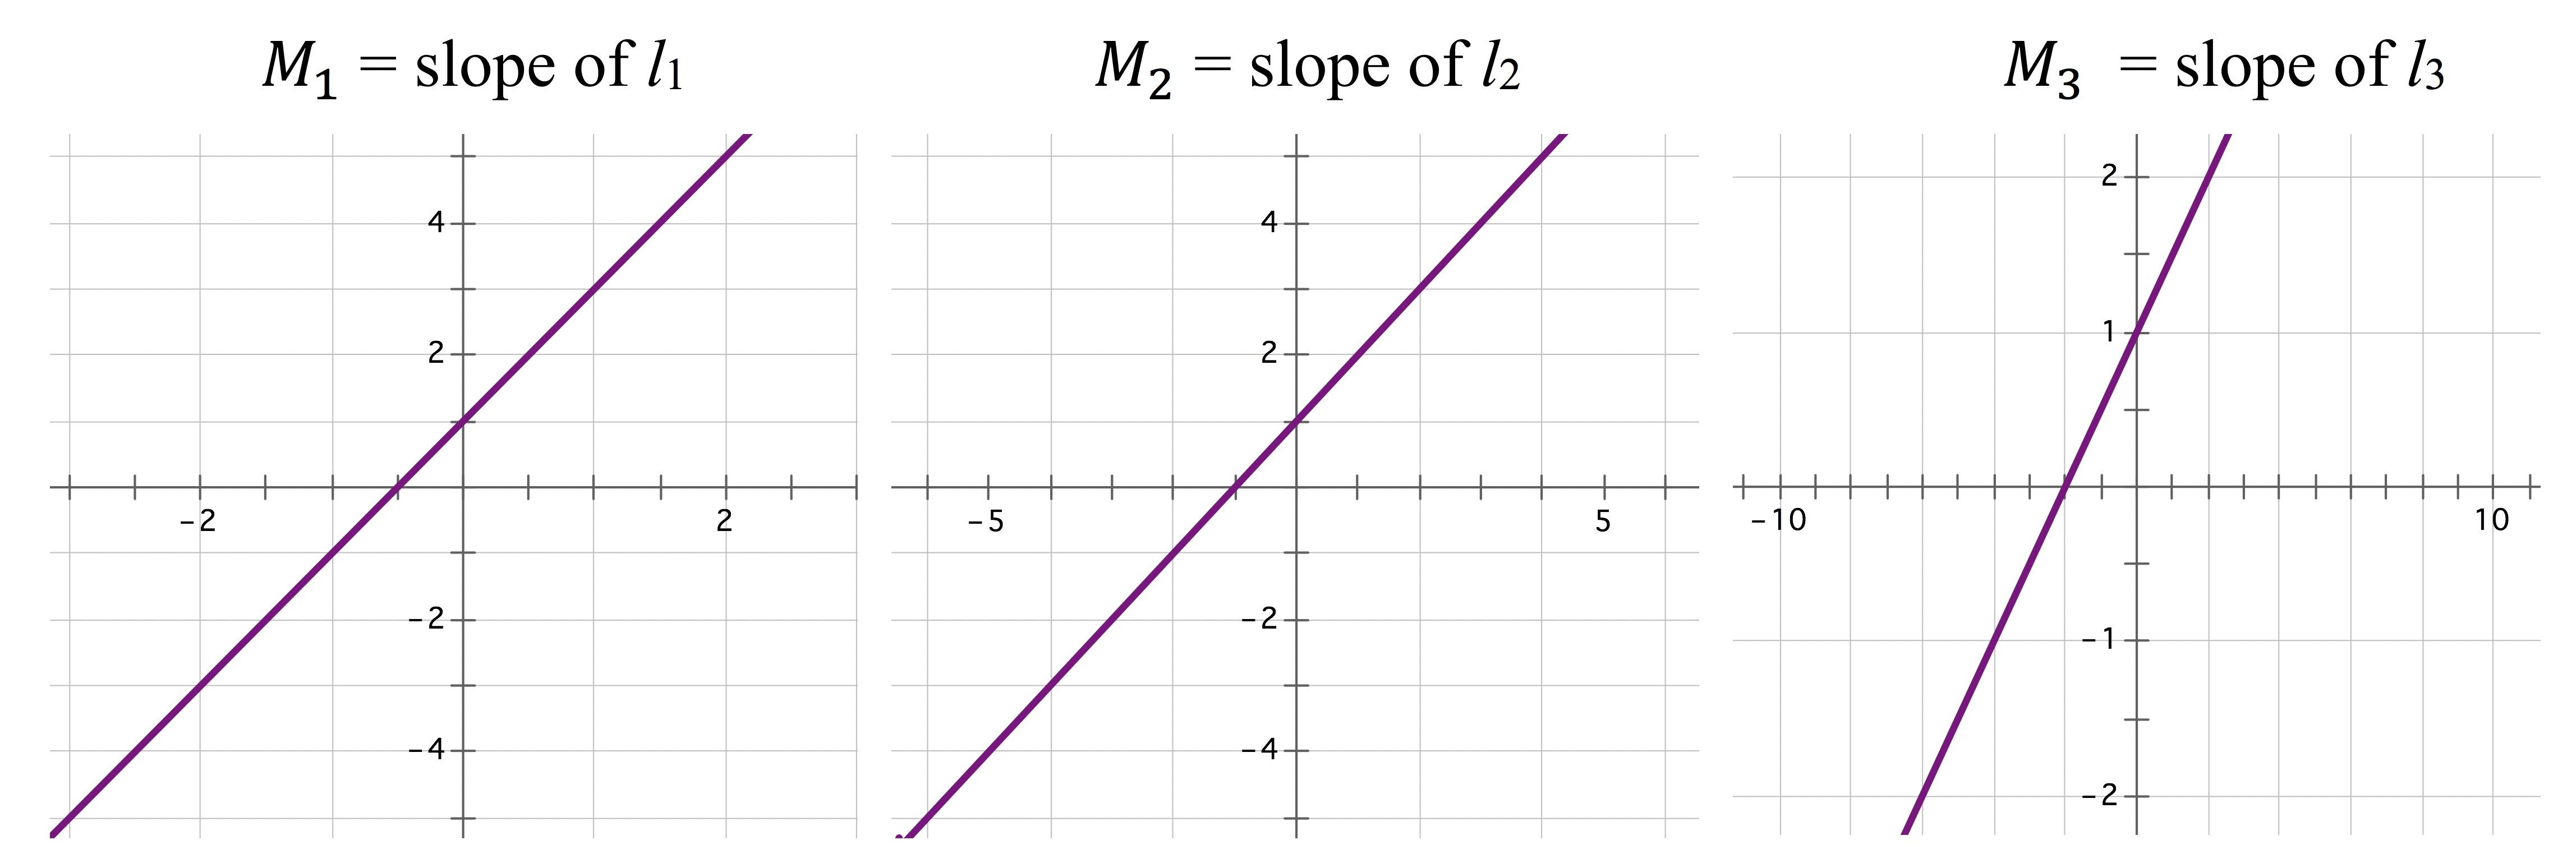
Given the graphs of three linear functions, , and with slopes , , and as shown below. Order the slopes of the lines from smallest to largest. (Be sure to note the scales on the axes).
Here are some questions you’ll be asked after you finish watching the videos. Please read through these before watching the videos.