You are about to erase your work on this activity. Are you sure you want to do this?
Updated Version Available
There is an updated version of this activity. If you update to the most recent version of this activity, then your current progress on this activity will be erased. Regardless, your record of completion will remain. How would you like to proceed?
Mathematical Expression Editor
Please answer this question to the best of your ability. You are welcome to re-watch
parts of any of the videos to help you.
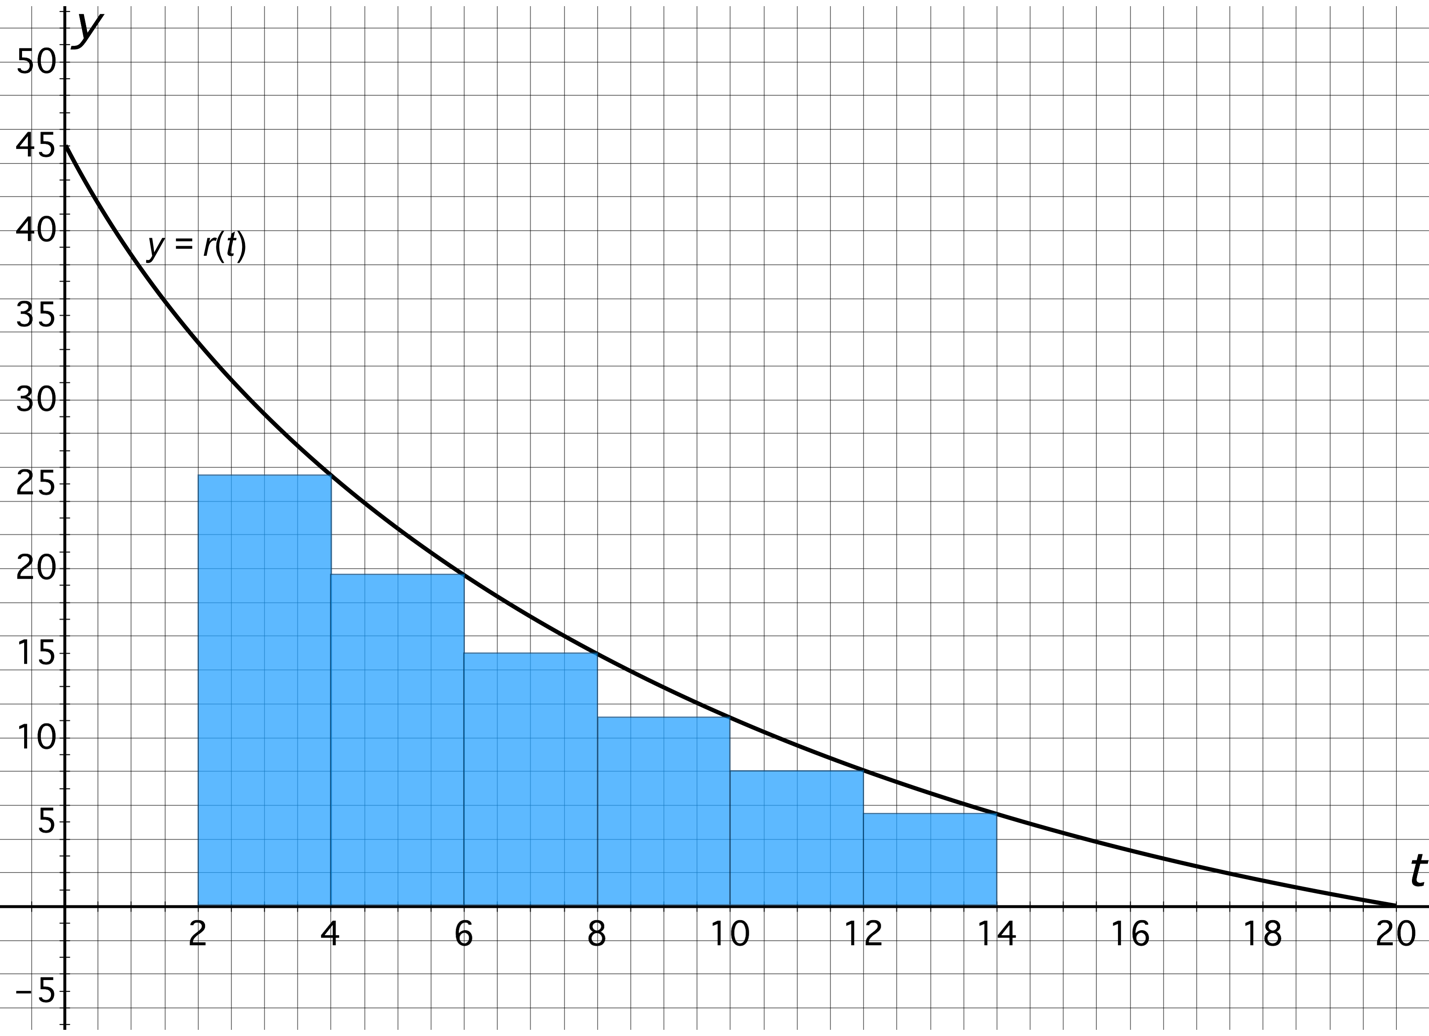
The function expresses the relationship between the rate at which water drains from
a tank (in gallons per minute) and the number of minutes elapsed since water
started draining from the tank. What quantity does the sum of the areas of the blue
rectangles on the graph of the function below approximate?
The average rate at which water drained from the tank over the interval of time
from 2 to 14 minutes after water started draining from the tank.The total amount
of water drained from the tank over the interval of time from 2 to 14 minutes after
water started draining from the tank.The constant rate at which water would have
to drain for the tank to be empty 20 minutes after water started draining.The instantaneous rate at which water drains from the tank 14 minutes
after water started draining.The initial amount of water in the tank.
The function represents the relationship between the rate of change in the value of
investment stocks (in dollars per month) and the number of months elapsed since
the stocks were purchased. Which of the following sums approximates the change in
the value of the stocks over the interval of time from 4 to 7 months after the stocks
were purchased?
The table below shows the horizontal velocity of a baseball (in feet per second) for
various values of , which is the number of seconds elapsed since the baseball was
thrown.
t
0
0.25
0.5
0.75
1
1.25
1.5
1.75
2
v(t)
132
130.03
128.08
126.16
124.27
122.41
120.58
118.78
117
Approximate the total distance the ball traveled during the first two seconds after it
was thrown by computing a left-hand Riemann sum with four terms.