Instructions for making graphics and videos.
Images
One way to insert images into a Ximera activity, is to have the image in the directory with \includegraphics. We recommend using the image environment for all of you images.
\begin{image}

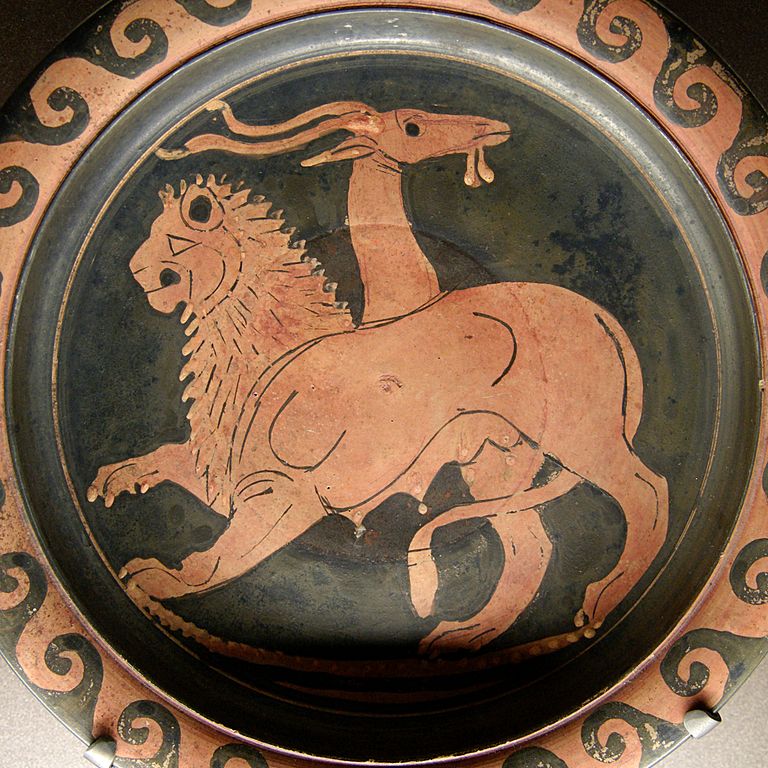
\includegraphics{chimera.jpg}

\end{image}

\graphicspath{

{./}

{graphicsAndVideos/}

}
To add graphics side-by-side, you can just place them in image tags:


\begin{center}

\includegraphics{chimera.jpg}\quad

\includegraphics{dna.jpg}

\end{center}
When done this way, the pictures will rearrange themselves depending on the width
of the screen.
Another way to include graphics is to use Tikz. In some sense this is preferred, as then the source produces the images.
\begin{image}

  \begin{tikzpicture}

    \begin{axis}[

        xmin=-6.4,

        xmax=6.4,

        ymin=-1.2,

        ymax=1.2,

        axis lines=center,

        xlabel=$x$,

        ylabel=$y$,

        every axis y label/.style={at=(current axis.above origin),anchor=south},

        every axis x label/.style={at=(current axis.right of origin),anchor=west},

      ]

      \addplot [ultra thick, blue, smooth] {sin(deg(x))};

    \end{axis}

  \end{tikzpicture}

\end{image}
Interactive graphics
The graph command
The easiest way to include an interactive graph is to use the \graph command. Unfortunately, the \graph command doesn’t draw a graph in the PDF, rather, it states (in words) that a graph is produced. There are a number of options for the \graph command:
Change viewing window
\[Restricting domain
\graph[xmin=-5,xmax=5,ymin=-5,ymax=5]{y=x^2}
\]
\[Default panel displayed
\graph{x^2 \left\{ 1 \leq x \leq 10 \right\} }
\]
\[Restricting window
\graph[panel]{x^2}
\]
\[Axis labels
\graph[xmin=0, xmax=10, ymin=0, ymax=10]{x^2}
\]
\[Hide axes
\graph[xAxisLabel="time", yAxisLabel="distance"]{y=x}
\]
\[Hide tick marks
\graph[hideXAxis=true, hideYAxis=true]{x^2}
\]
\[Polar graphing
\graph[hideXAxisNumbers=true, hideYAxisNumbers=true]{x=y^2}
\]
\[Polar gridlines
\graph{r=\theta}
\]
\[Graphing a piecewise function
\graph[polar]{y=x^2}
\]
\[

\graph{ \sin(x)\left\{x<0\right\}, 2x\left\{ x>=0 \right\} }

\]
Desmos
If you require further features from Desmos, you can sign up for an account and include your worksheets like this:
\begin{center}

\desmos{zwywds7med}{800}{600}

\end{center}
GeoGebra
You can also use GeoGebra. Embed the widget using the syntax \geogebra{ID}{width}{height}, where ID is the widget ID and width and height are the dimensions (in pixels) you want the embedded widget to have.
\begin{center}

\geogebra{XC3FXUdJ}{800}{600}

\end{center}
Note, you may wish to use the onlineOnly environment with your interactives.
Videos
You can also embed YouTube videos.
\begin{center}

\youtube{0aQpLSu2fMs}

\end{center}